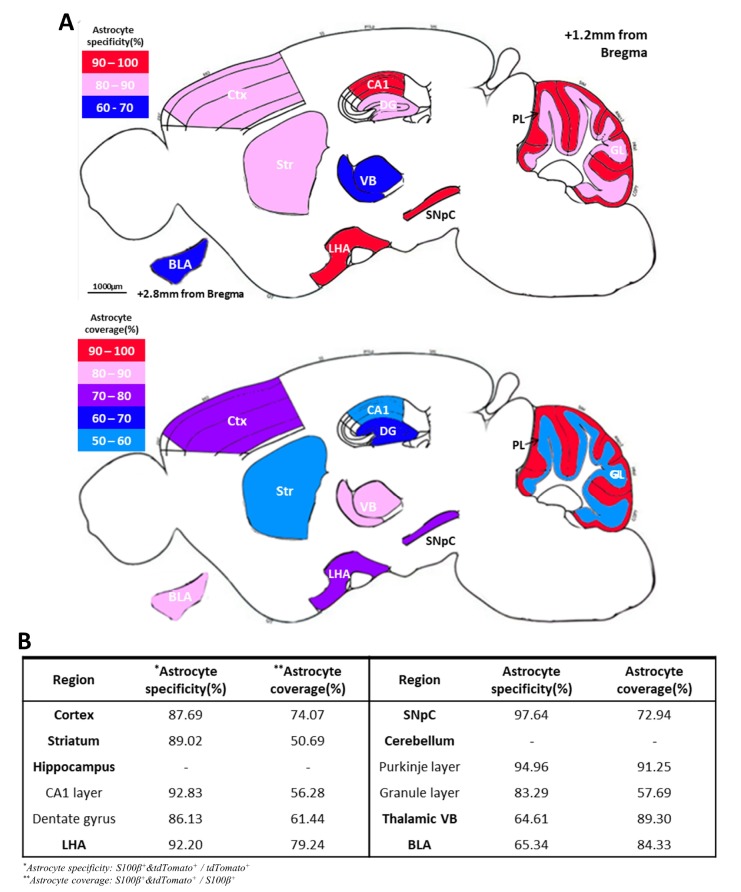
Fig. 10. Summary of astrocyte specificity and coverage of hGFAP-CreERT2 in various brain regions. (A) Schematic sagittal section diagram shows heterogeneous astrocyte specificity (top) and coverage (bottom). Astrocyte specificity is summarized in top diagram, red=over 90%; pink=80 to 90%, and navy=60 to 70%. Astrocyte coverage is summarized in bottom diagram, red=over 90%; pink=80 to 90%; purple=70 to 80%; navy=60 to 70%; and blue=50 to 60%. (B) Summary table of quantitative analysis results in each characterized region.
© Exp Neurobiol