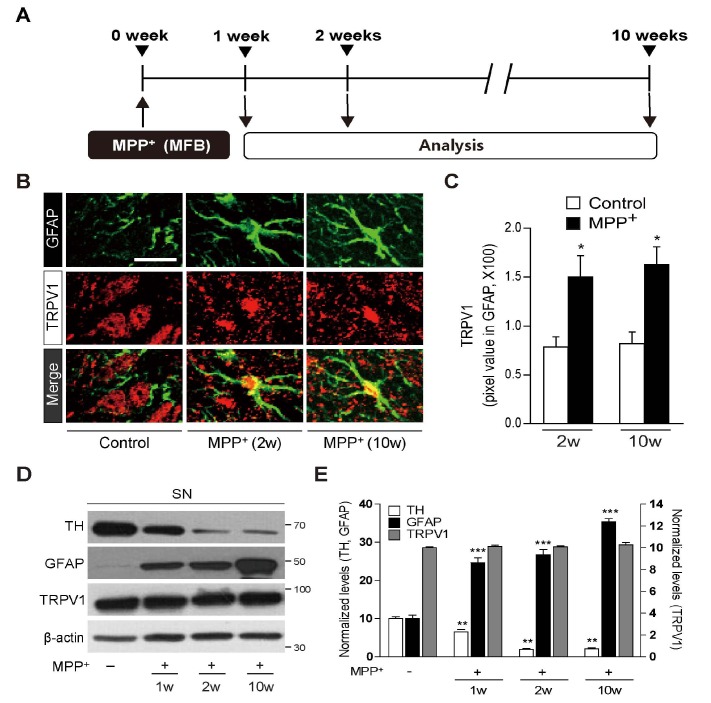
Fig. 3. Prolonged expression of astrocytic TRPV1 in MPP+-lesioned rat SNpc in vivo. (A) Schematic diagram of the experiment. Rats were analyzed at 1, 2 and 10 weeks (w) after unilateral MFB injection of MPP+. (B) Fluorescence images of TRPV1 (red) and GFAP (green) and both images are merged in the rat SNpc at 2 and 10 weeks post MPP+ or contralateral SNpc as a control. Scale bars: 20 µm. Magnification: 20× (C) Quantification of TRPV1 expression co-localized with GFAP+ astrocytes in the SNpc of MPP+-lesioned rat brain at indicated time point. (D) Western blot analysis of TH, GFAP and TRPV1 and (E) Quantification in the MPP+-lesioned rat SN at indicated time point. C and E, *p<0.05, **p<0.01, ***p<0.001, significantly different from control. Mean±s.e.m.; One way ANOVA with Newman-Keuls analysis and Student t-Test.
© Exp Neurobiol