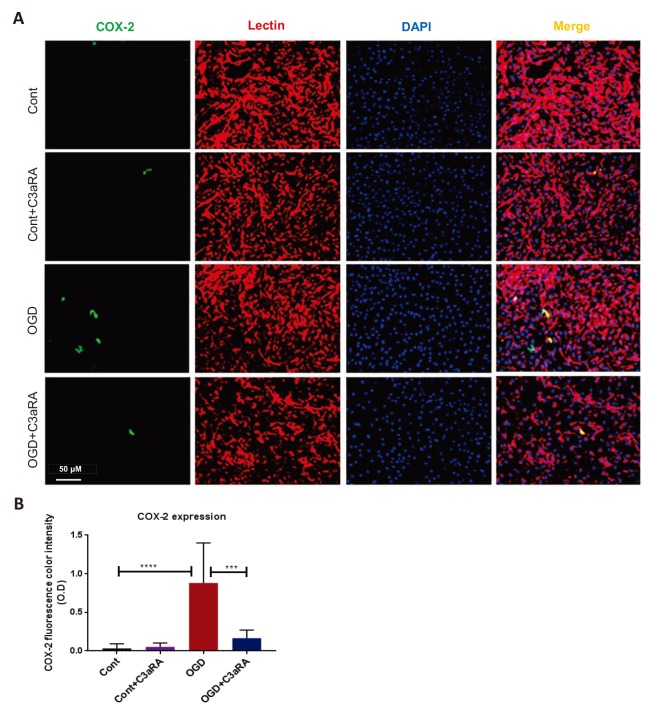
Fig. 4. C3aRA treatment reduces expression of Cox-2 in bEnd.3 cells following OGD. A) C3aRA significant reduces Cox-2 expression in OGD samples by immunocytochemistry. B) Cox-2 color intensity was measured by Image J. The results represent the means±SEM of fold changes (n=5). *p<0.01, **p<0.001, ***p<0.0001. Cont, control group; OGD, ischemic group; Cont+C3aRA, drug control; OGD+C3aRA, drug treatment.
© Exp Neurobiol