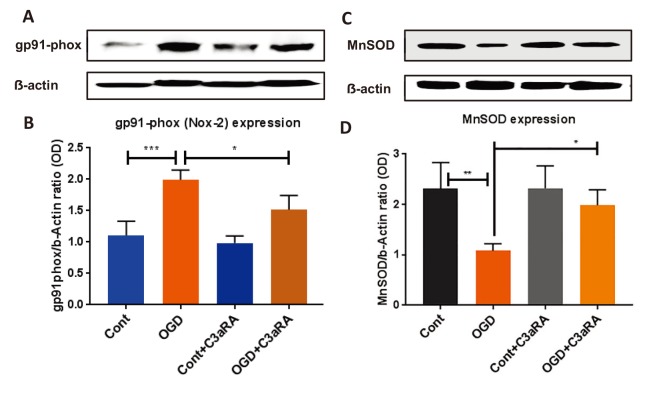
Fig. 5. Effect of C3aR inhibition on gp91-phox and MnSOD expression level in endothelial cells following OGD. A) gp91-phox expression was determined by western blotting. B) gp91-phox densitometry analysis was done by Image J. C) Representative western blot showing endothelial expression of MnSOD. D) MnSOD densitometry analysis was done by Image J. The results represent the means±SEM of fold changes (n=4). *p<0.01, **p<0.001, ***p<0.0001. Cont, control group; OGD, ischemic group; Cont+C3aRA, drug control; OGD+C3aRA, drug treatment.
© Exp Neurobiol