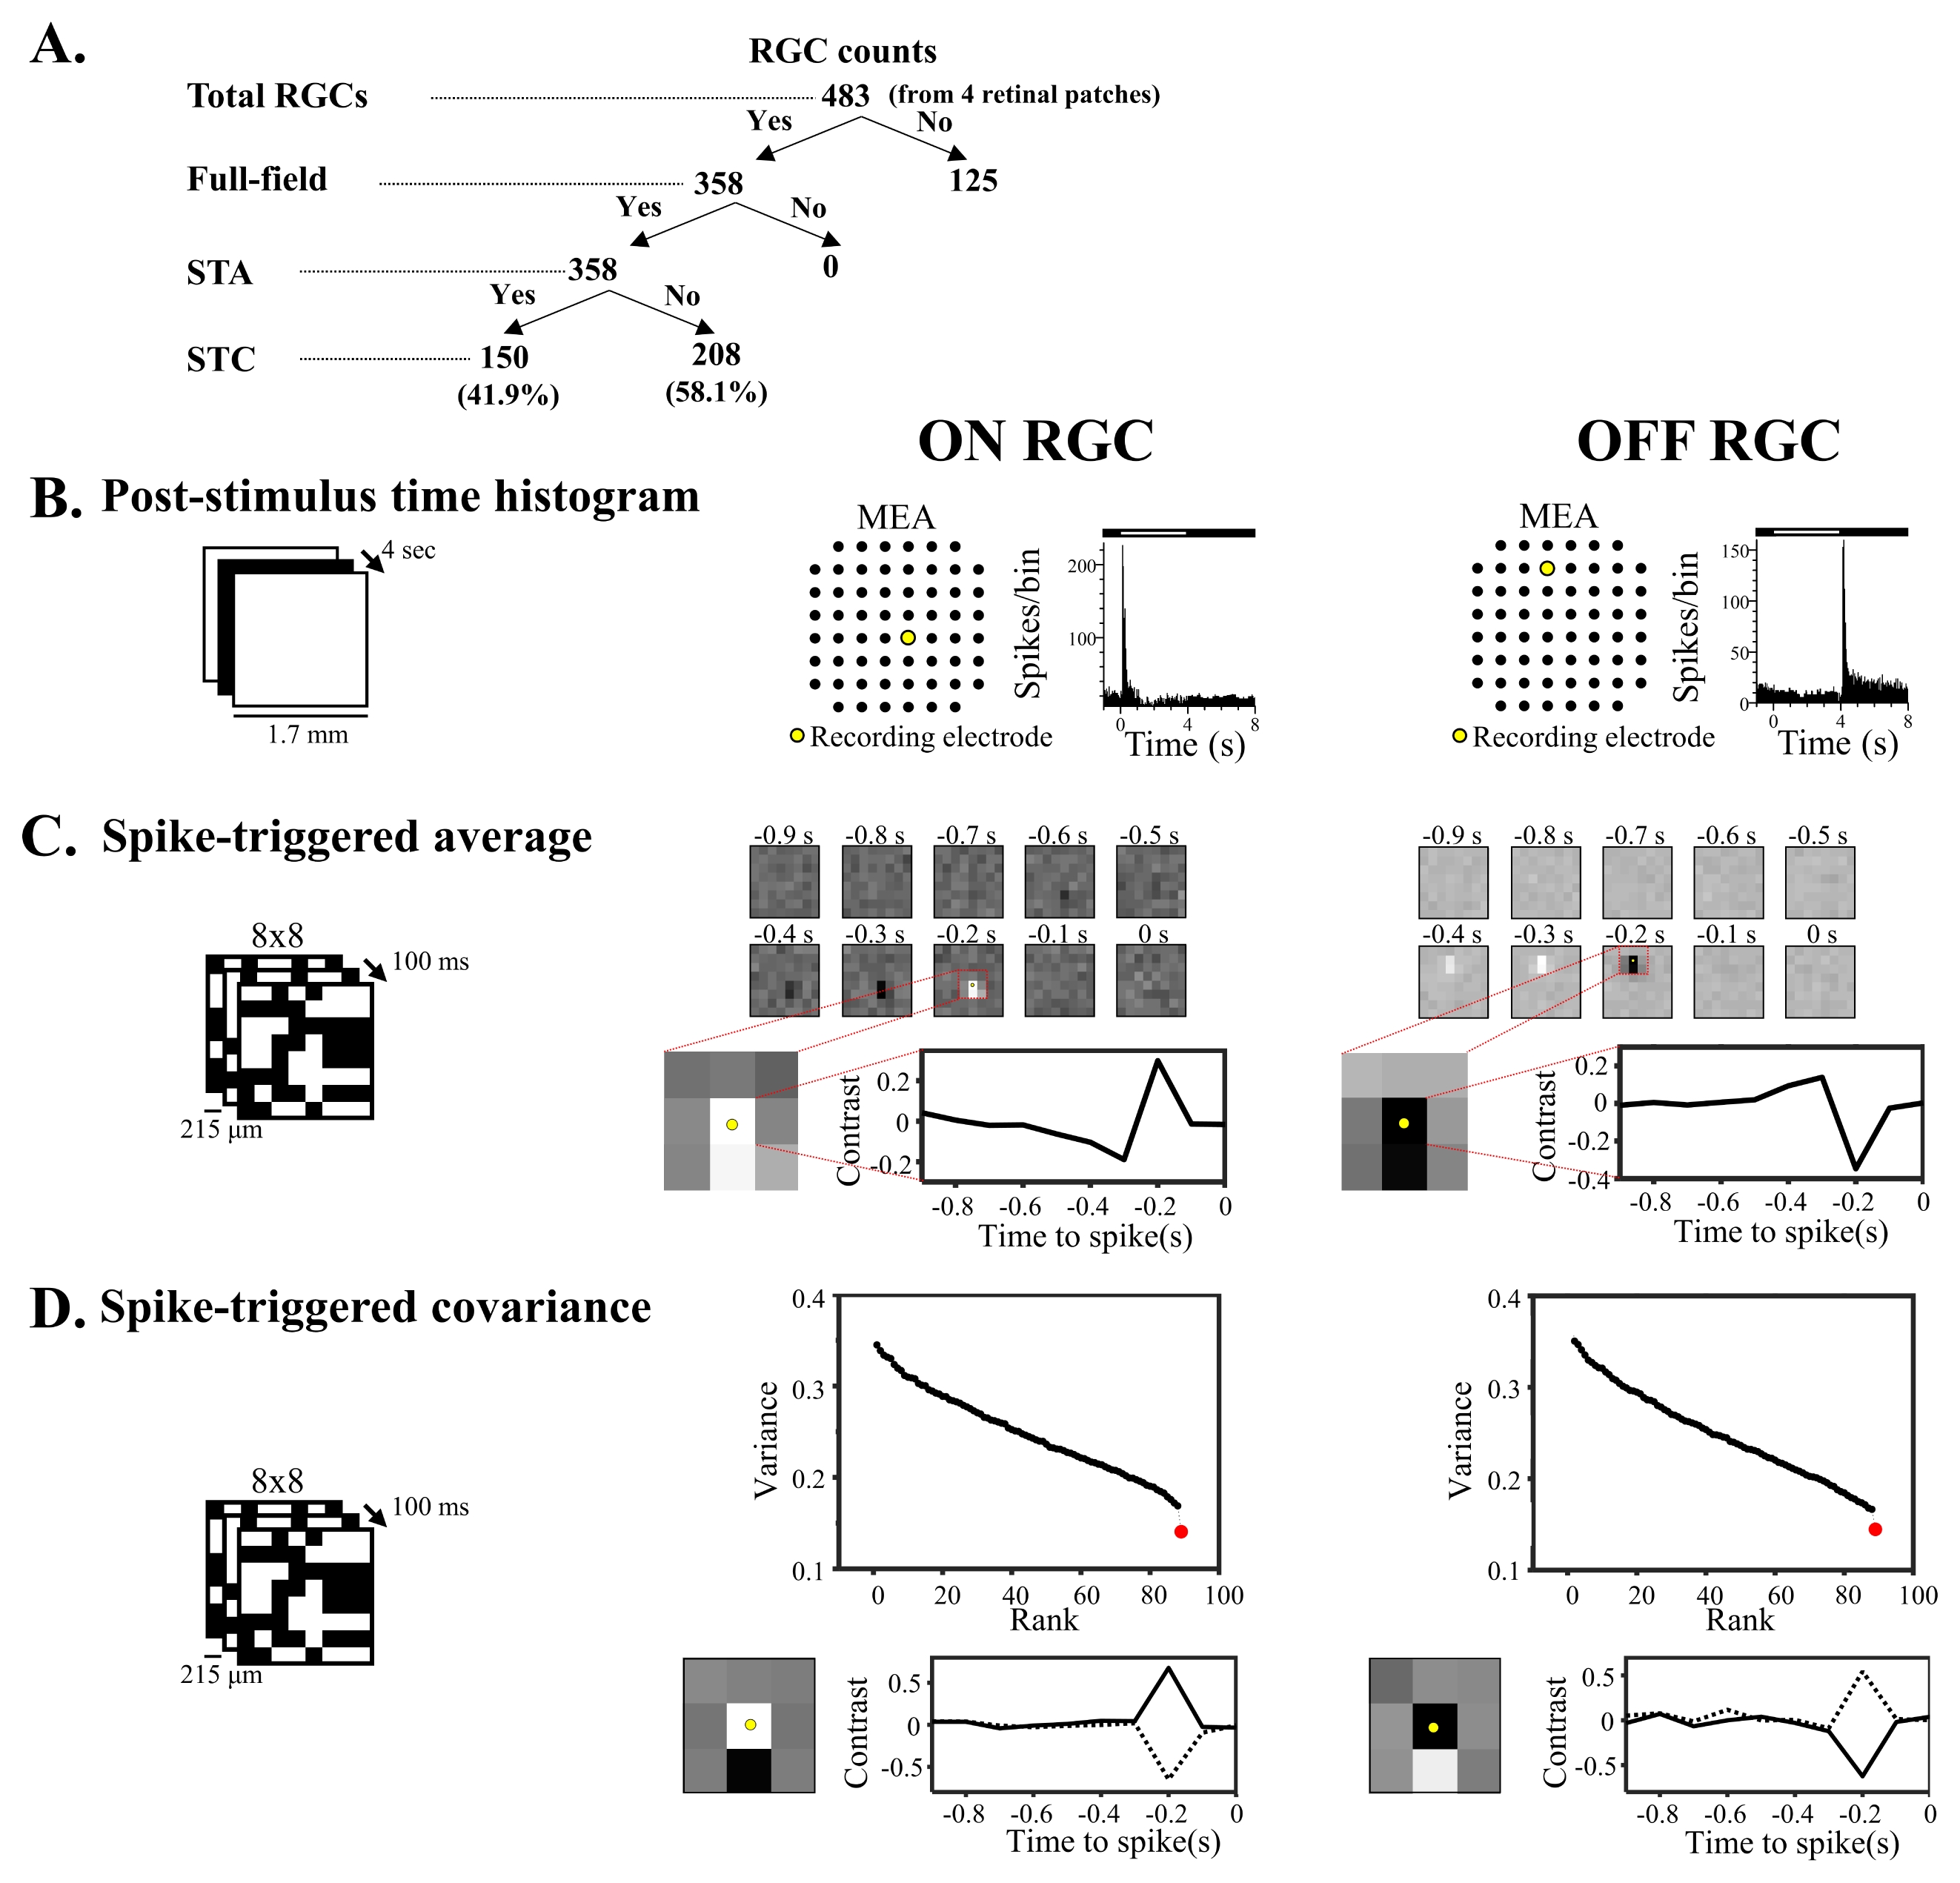
Typical spatiotemporal profiles of RFs through STA and STC. (A) The number of RGCs used in every stage of the analysis. (B) PSTH graphs of RGC response to full-field illumination of 4 s ON and 4 s OFF duration, respectively (time bin: 50 ms). In the 8×8 grid MEA layout, a yellow circle indicates the recording electrode (ON cell: electrode 55, OFF cell: electrode 42). (C) Upper panel: spatial profiles of STA to a pixel width of 215 μm in time from −0.9 s to −0.1 s before a spike. Bottom left: spatial patterns in ROI of STA marked with a red dotted square consisting of 9 pixels around the recording electrode. Yellow circle indicates the electrode position in the ROI. Bottom right: temporal profile of the one pixel in the 8×8 grid that shows maximum contrast (right). (D) STC analysis performed in ROI of 9 pixels. Upper panel: eigenvalue spectrum of the STC analysis. Significantly different variances are marked with red dots. Bottom left: Spatial profile of STC −0.2 s before a spike. Bottom right: Temporal profile of the two pixels in the ROI with highest absolute contrast (solid line: center pixel; dashed line: bottom center).