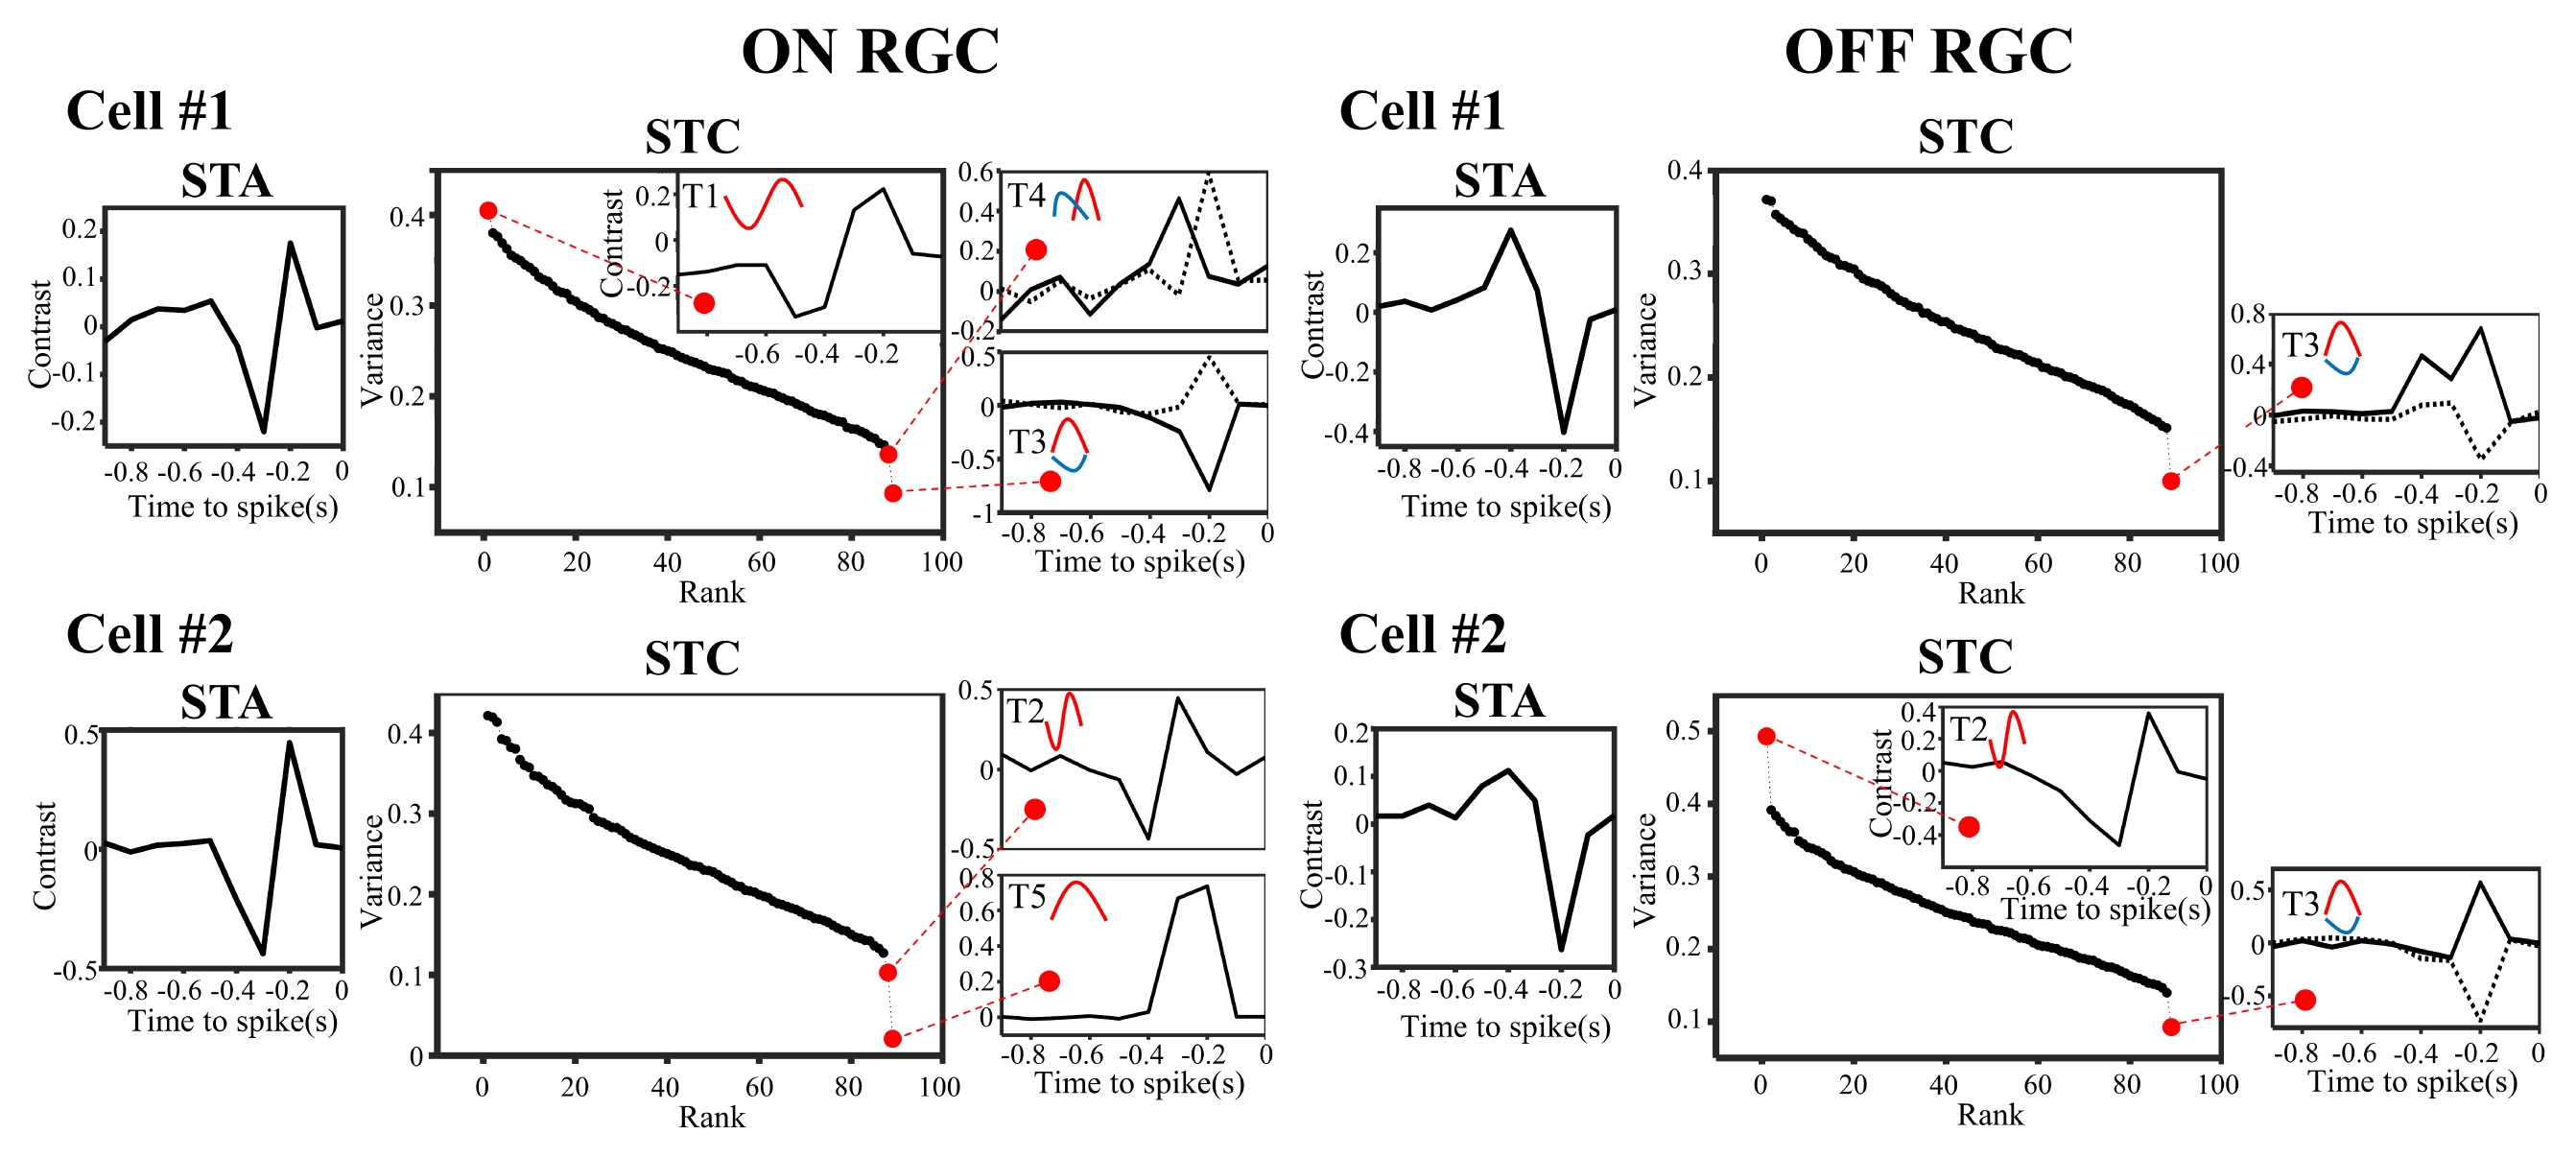
Exemplary temporal patterns of STC responses found in ON and OFF RGCs. Red dots indicate the significantly higher or lower variances shown in the eigenvalue spectrum. Each temporal profile corresponding to the significant variances is displayed. Five types of temporal profiles are shown in four (2 ON, 2 OFF) representative RGCs.