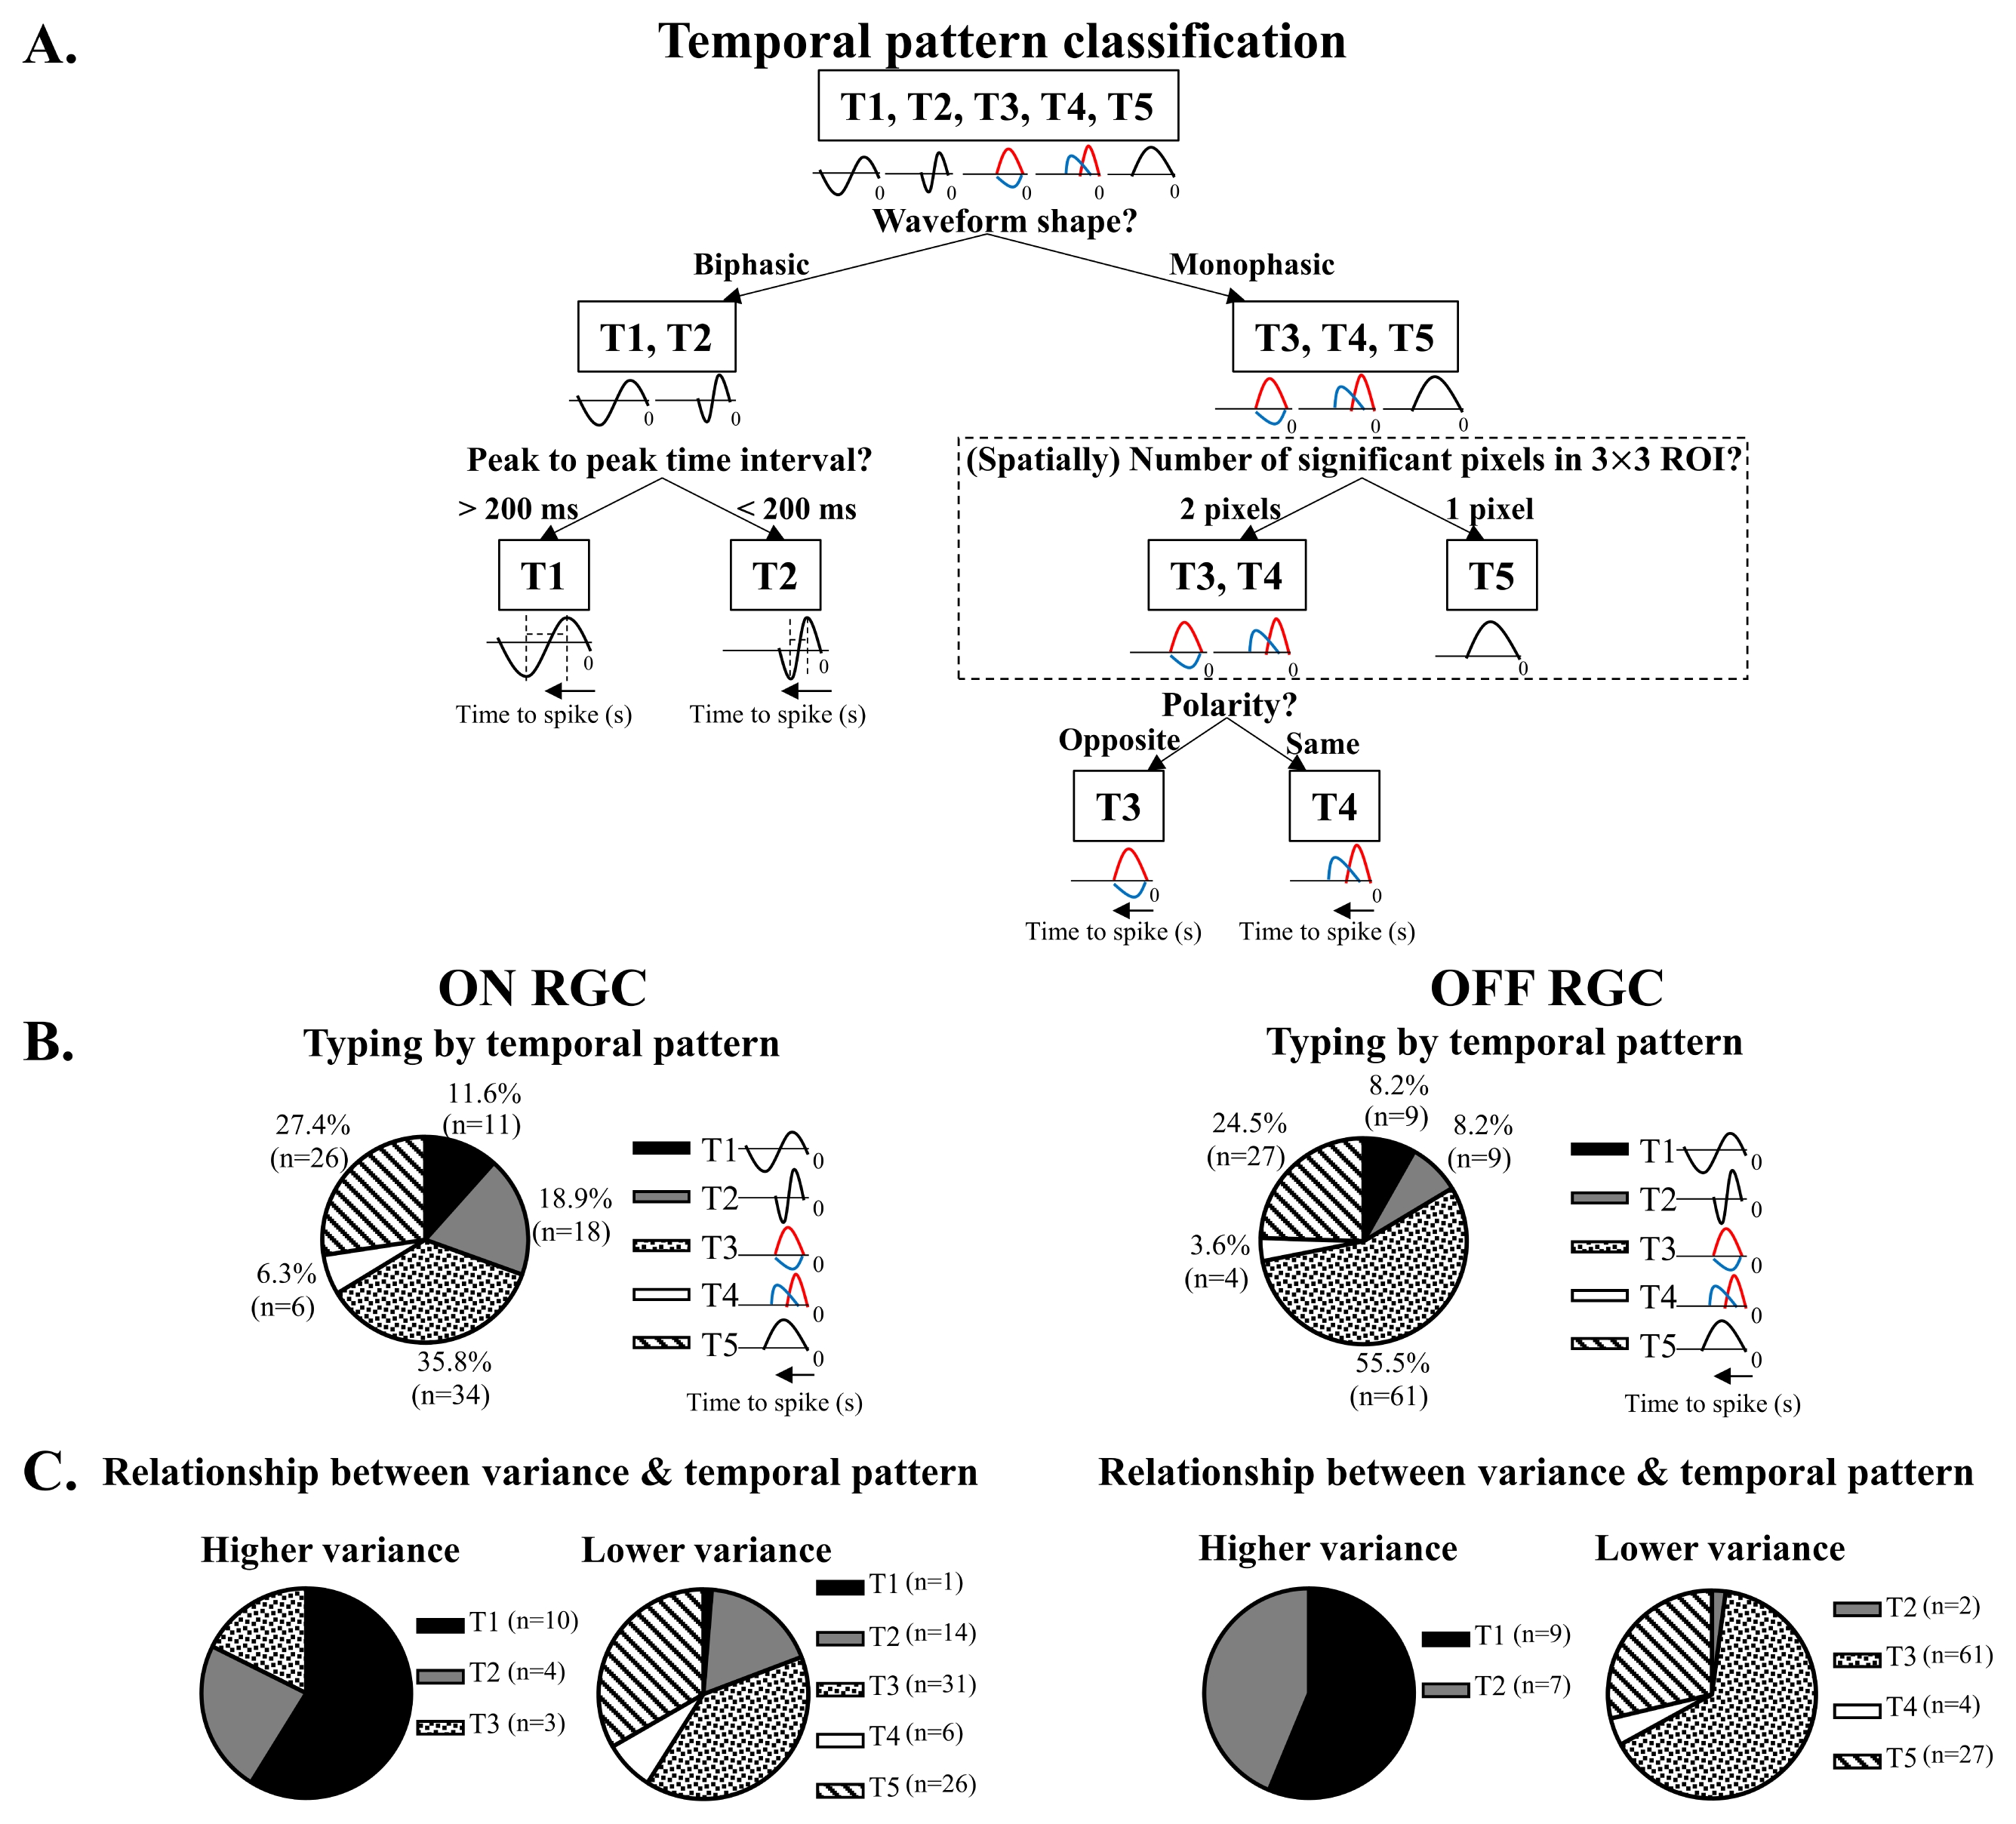
Temporal pattern classification based on STC analysis. (A) Classification of five temporal patterns (T1–T5) obtained by STC analysis. (B) Left: type distribution of 95 temporal patterns found among the 59 ON cells. Right: distribution of 110 patterns found among the 91 OFF cells. (C) The relationship between significantly higher or lower variances and their respective type of temporal pattern.