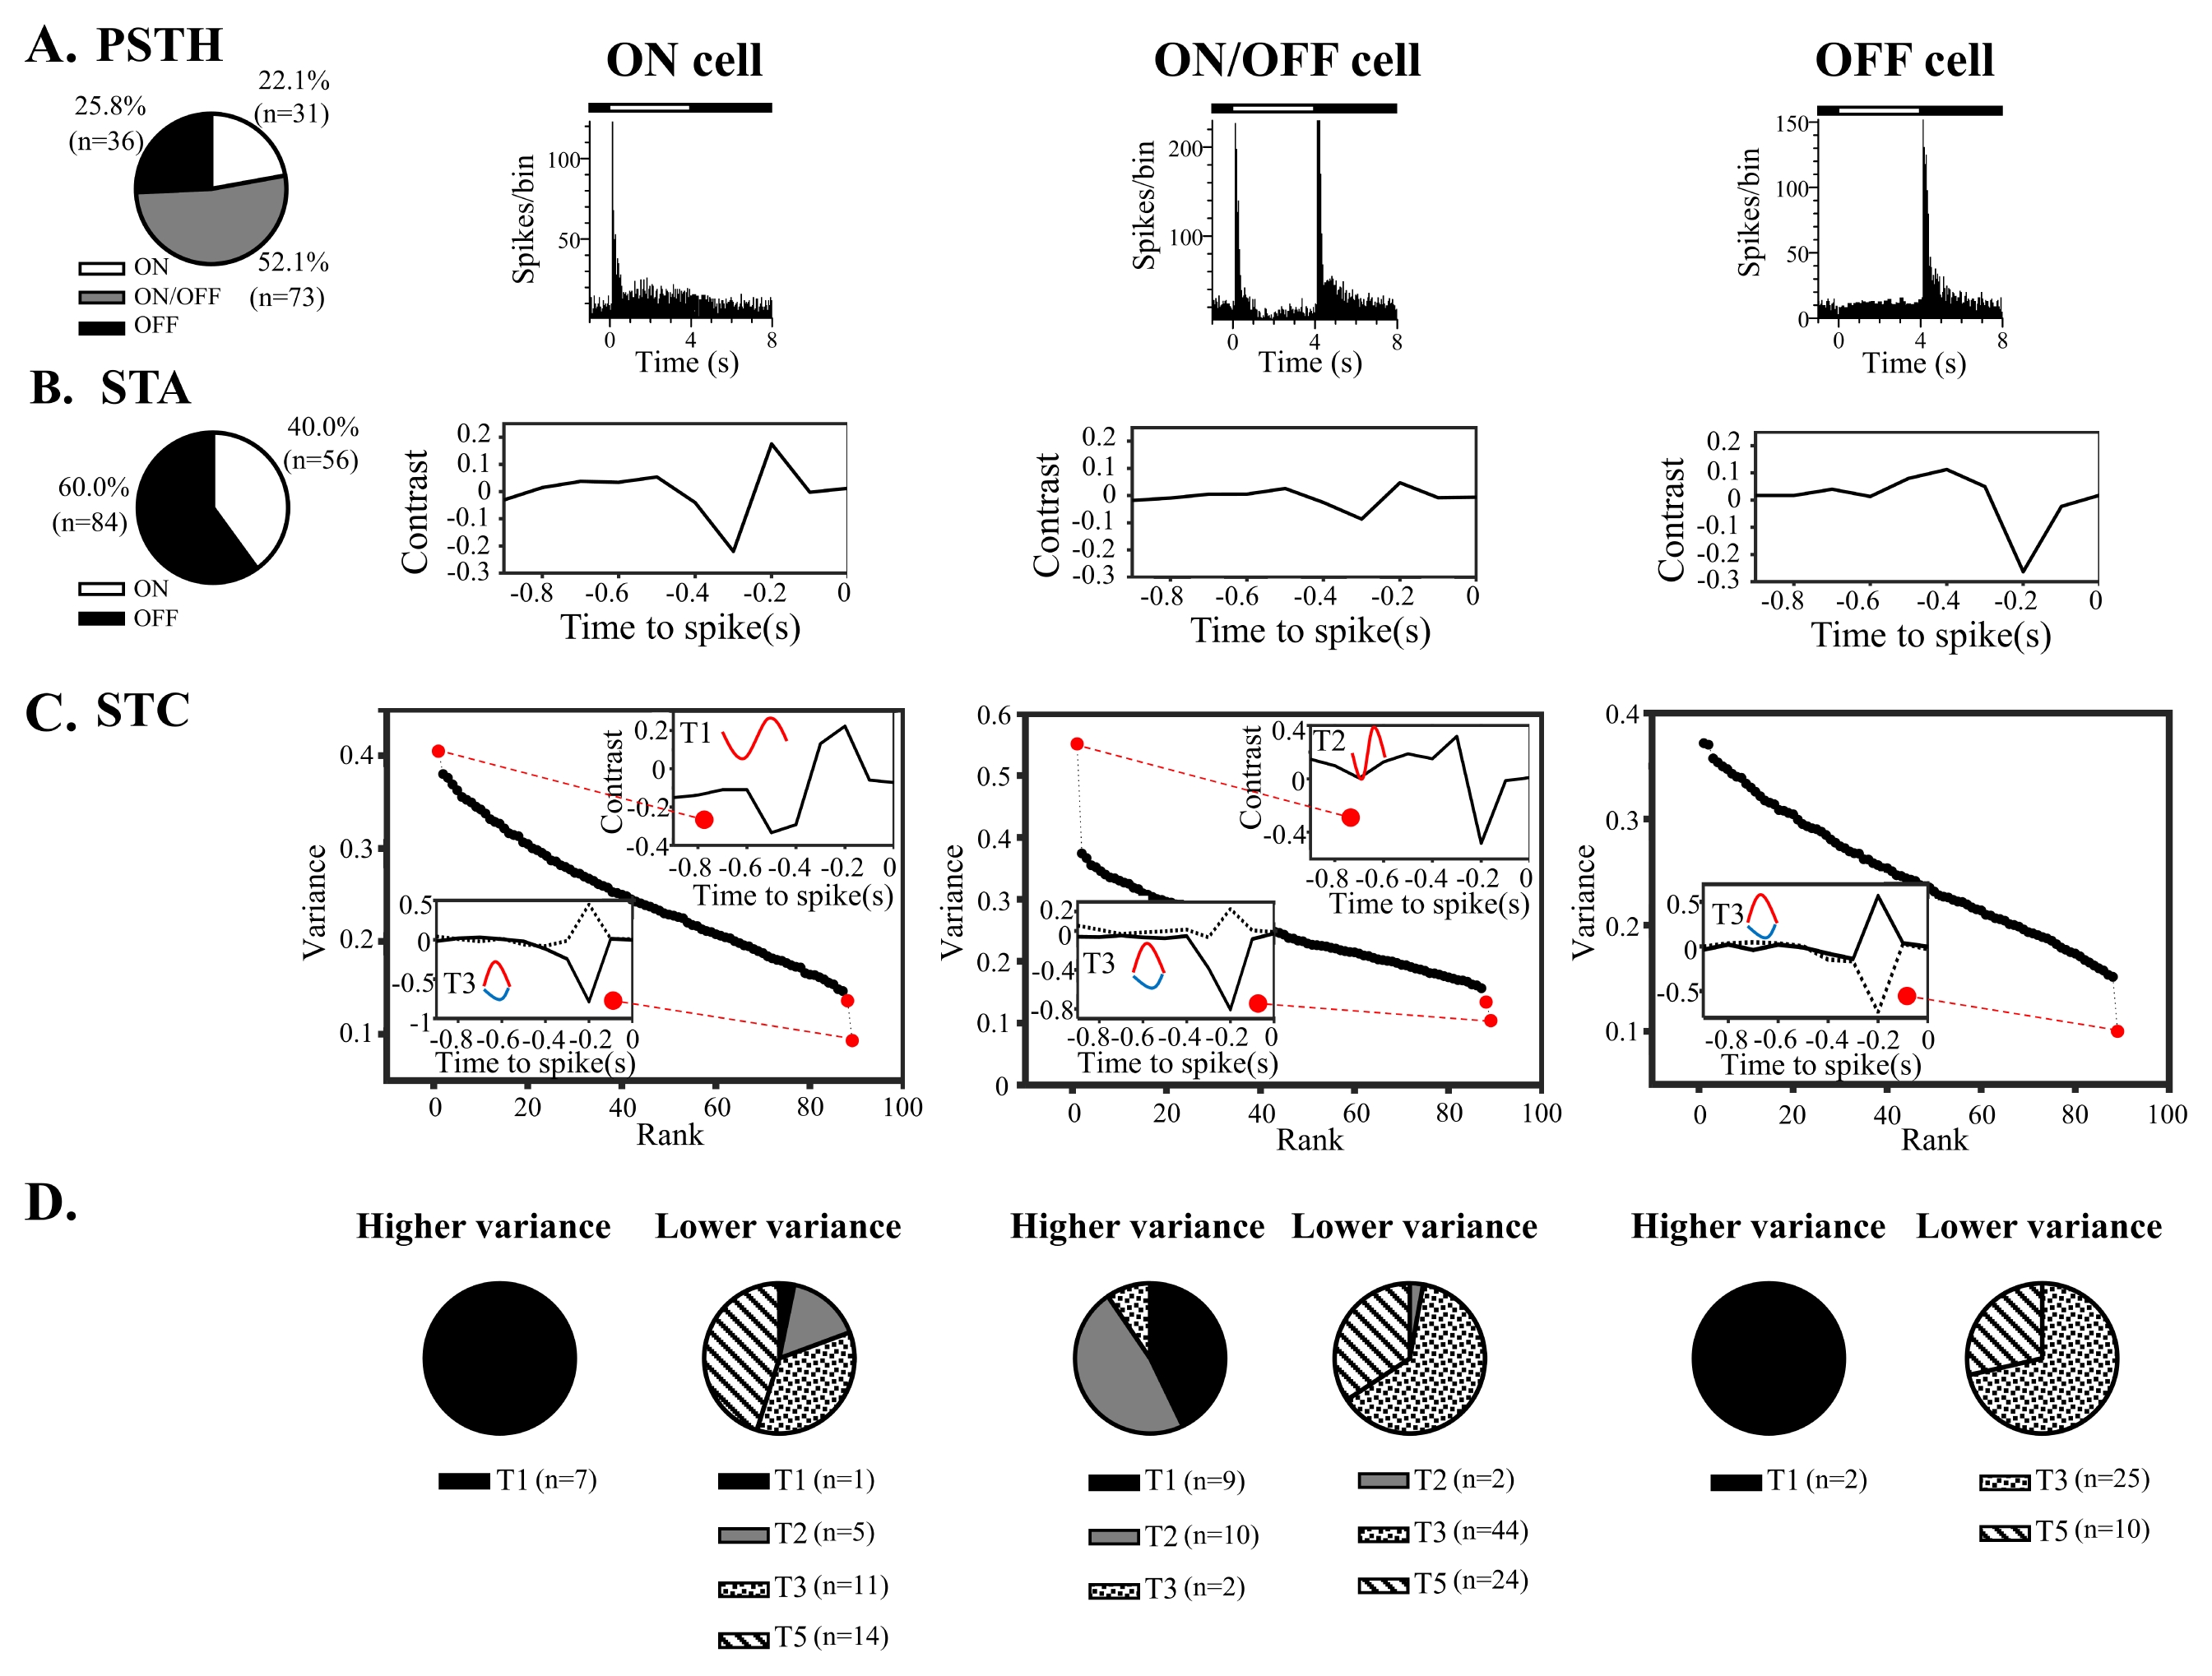
Matching of ON, ON/ OFF, and OFF RGC with STCbased temporal pattern type. (A) PSTH graphs of RGC response to full-field illumination of 4 s ON and 4 s OFF duration respectively (time bin: 50 ms). Three types of ON, ON/OFF, and OFF responses are shown. The percentage of the three types classified through PSTH is shown in the pie chart. (B) STA temporal profiles of ON, ON/ OFF, and OFF RGCs. (C) STC eigenvalue spectrum for ON, ON/OFF, and OFF cells. The temporal profiles of significant eigenvalues (marked by red dot) are shown as insets. (D) Distribution of the five temporal profiles for significantly higher and lower variances, separately for ON, ON/OFF, and OFF cells.