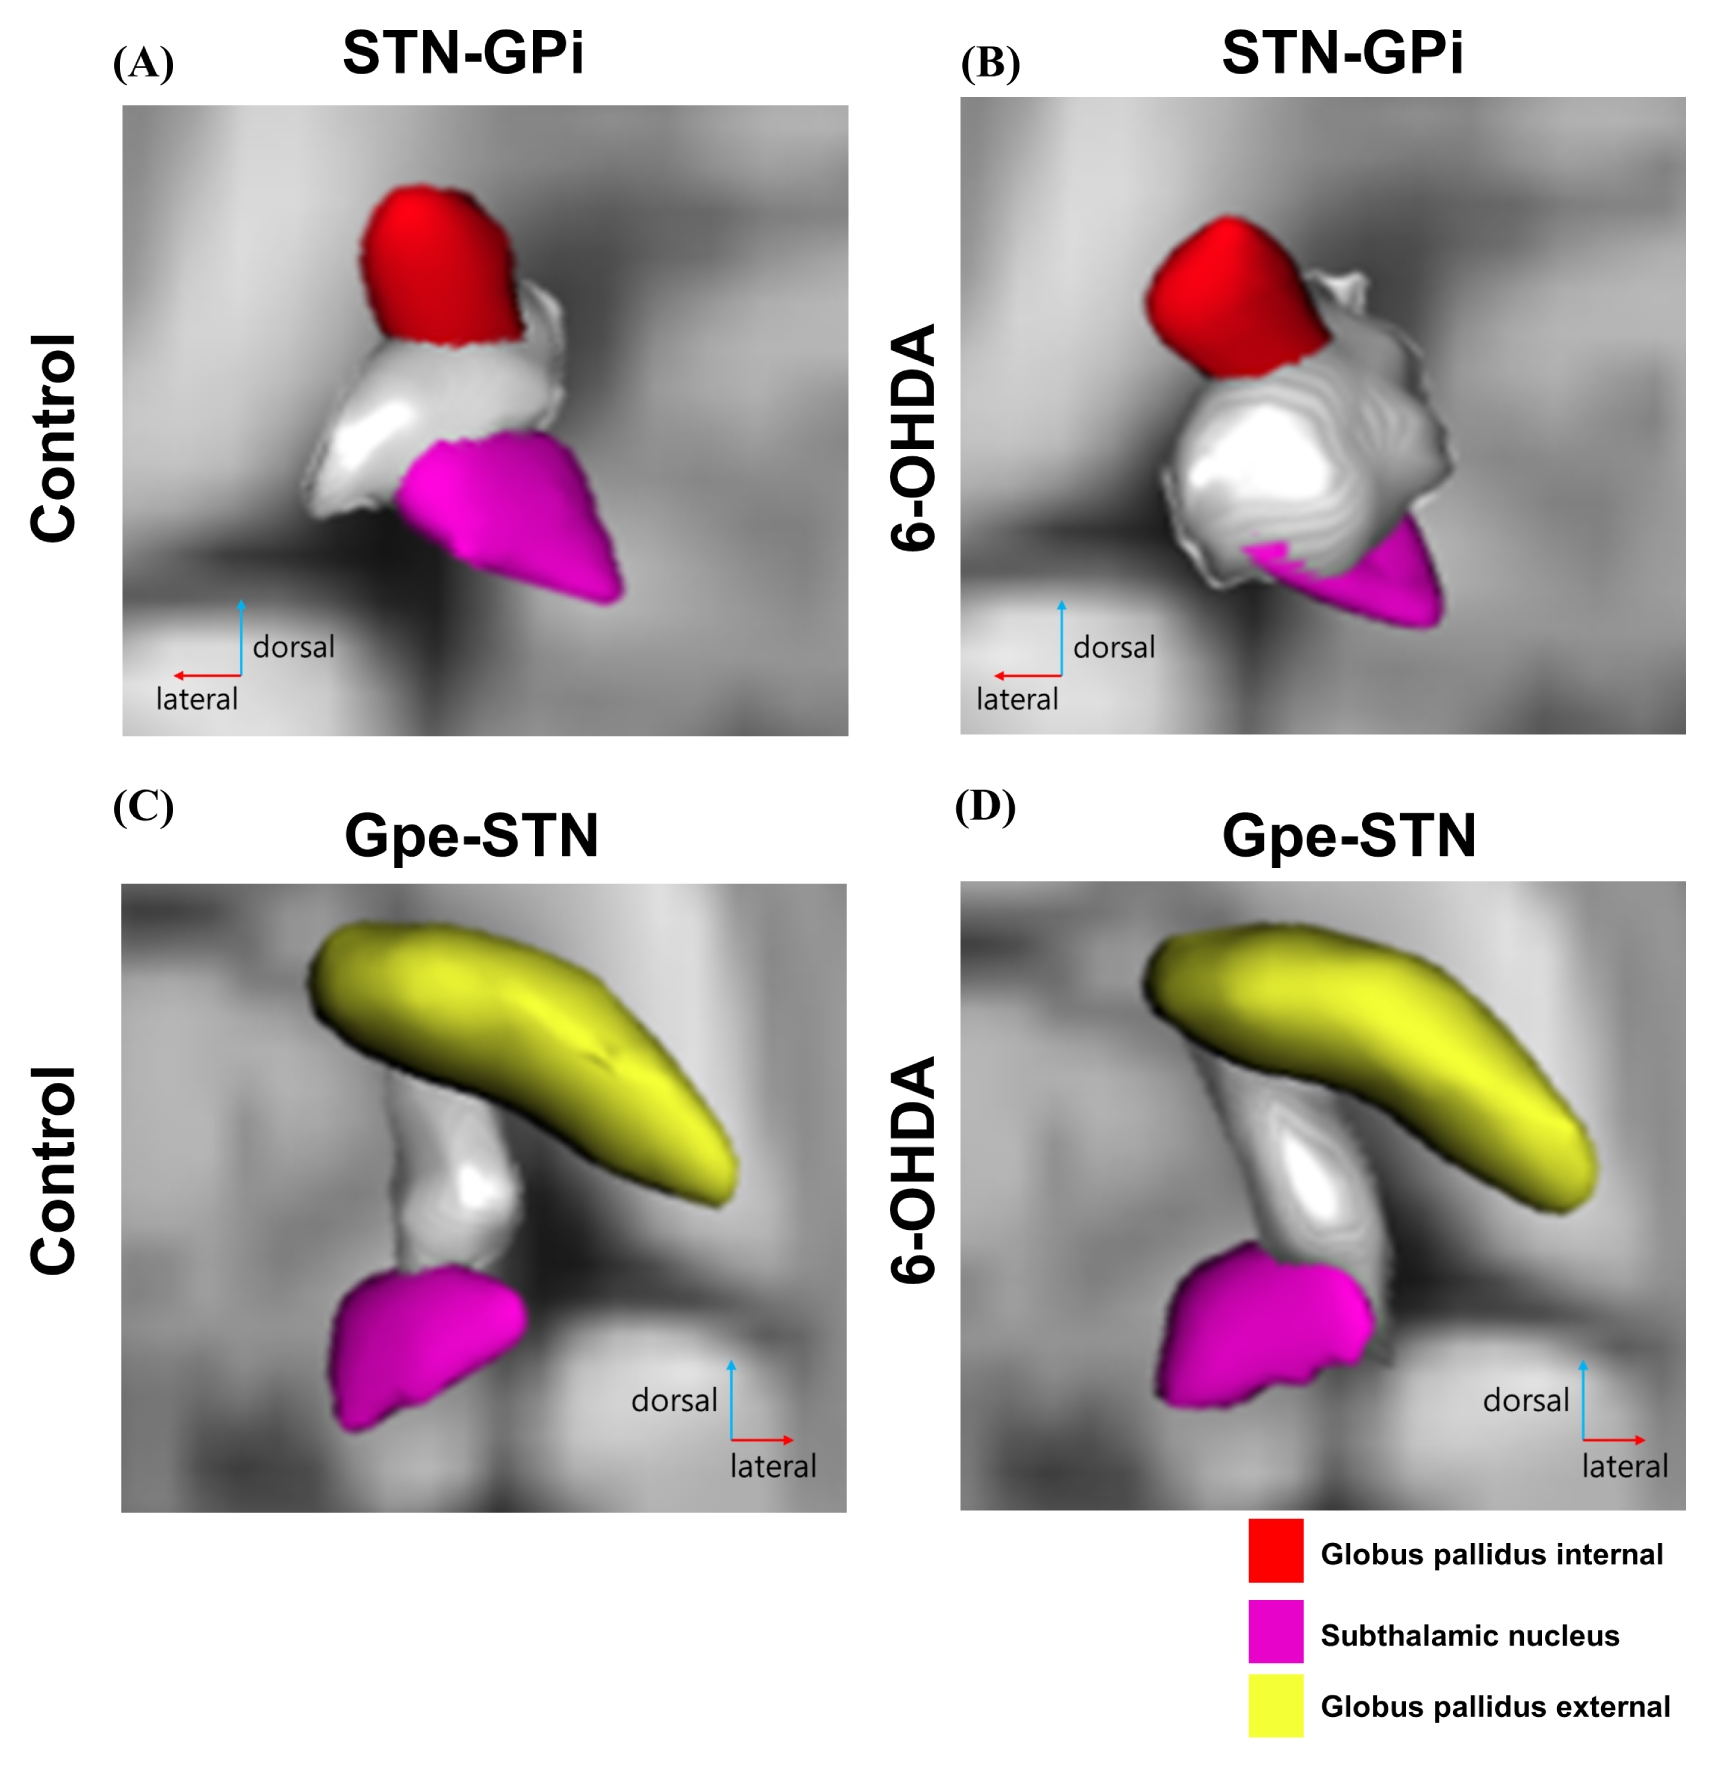
Detailed fiber connectivity between seed region and target region in control and 6-OHDA groups. This figure represents a 3D dorsal view of STN-GPi and GPe-STN tracts on an axial T2-weighted image. (A) and (B) show tracts interconnecting the left STN and the left GPi in control and 6-OHDA groups. (C) and (D) shows tracts interconnecting the right GPe and right STN in control and 6-OHDA groups (Red: GPi, Pink: STN, Gray: fiber path; (A) Left STN-left GPi in control, (B) Left STN-left GPi in 6-OHDA, (C) Right GPe-right STN in control, (D) Right GPe-right STN in 6-OHDA).