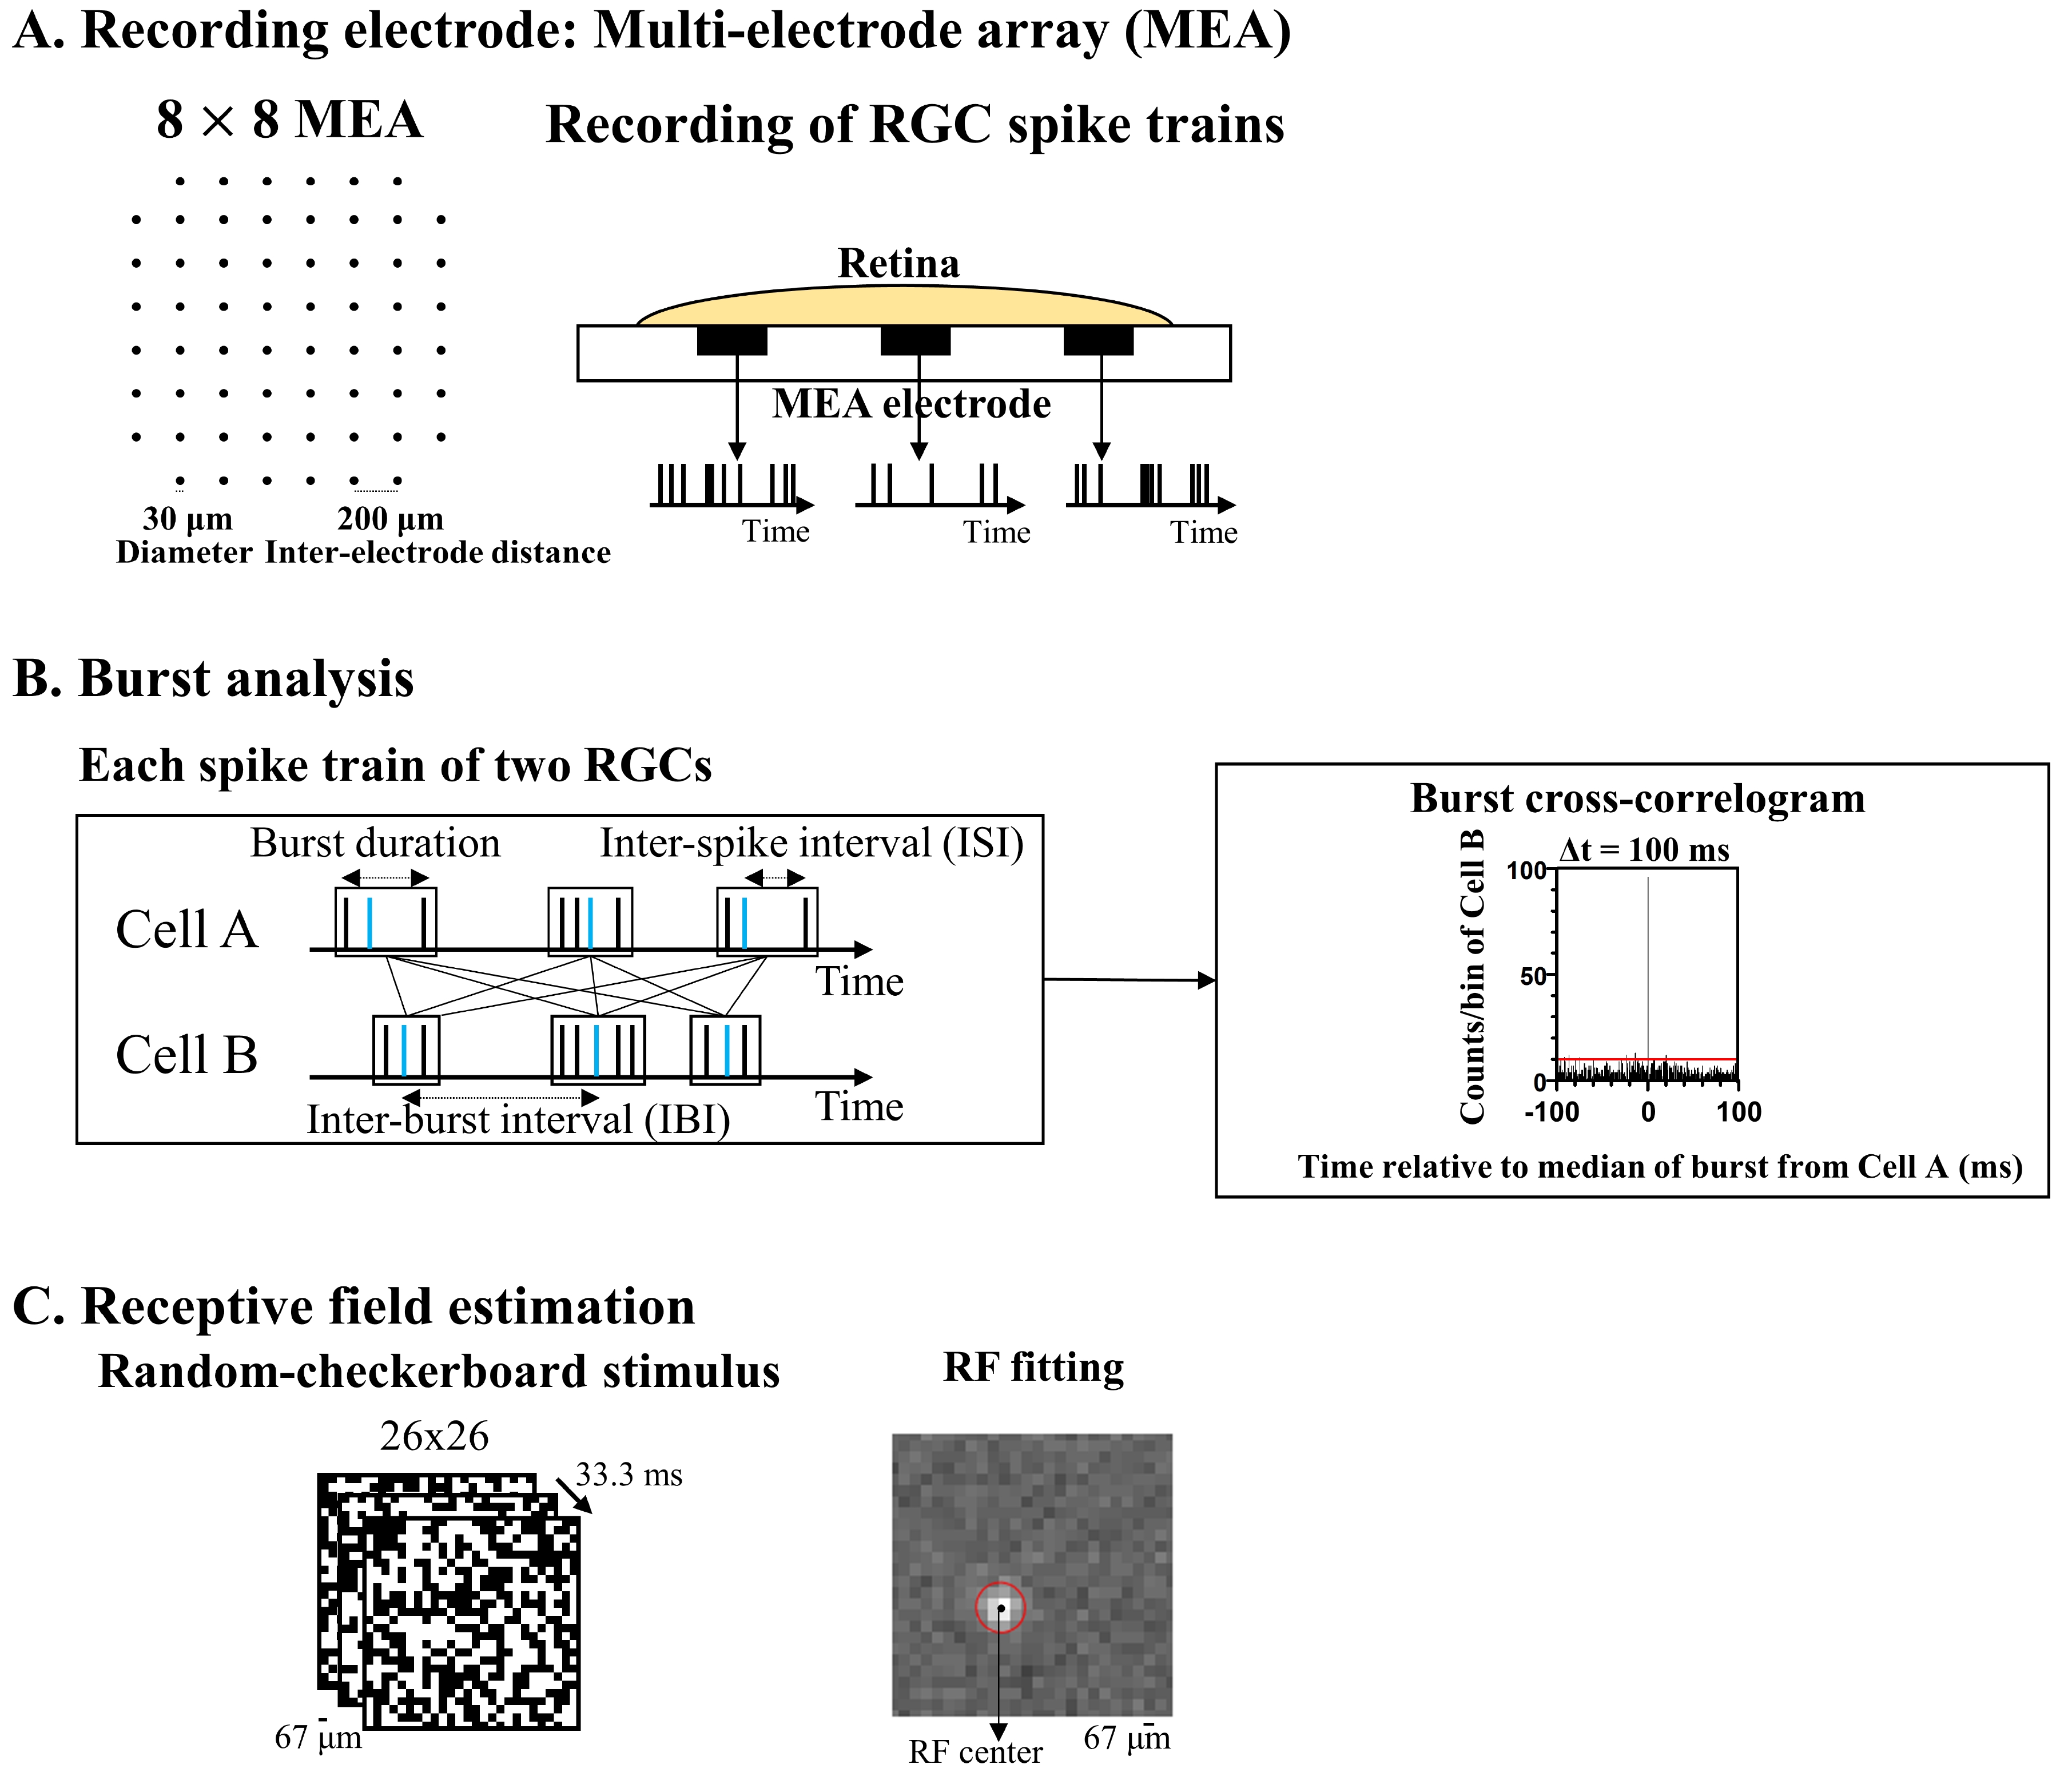
Fig. 1. Multi-channel recording system and burst analysis. (A) Configuration of a multi-electrode array (MEA) and recording of RGC spike trains. (B) Burst analysis parameters and burst cross-correlogram. Blue lines indicate the median time of each burst. The red lines indicate the significance level represented by the 99% confidence limit of the time histogram. (C) Random-checkerboard stimulation and receptive field (RF) estimation of RGC from the spatial map of spike-triggered average (STA).
© Exp Neurobiol