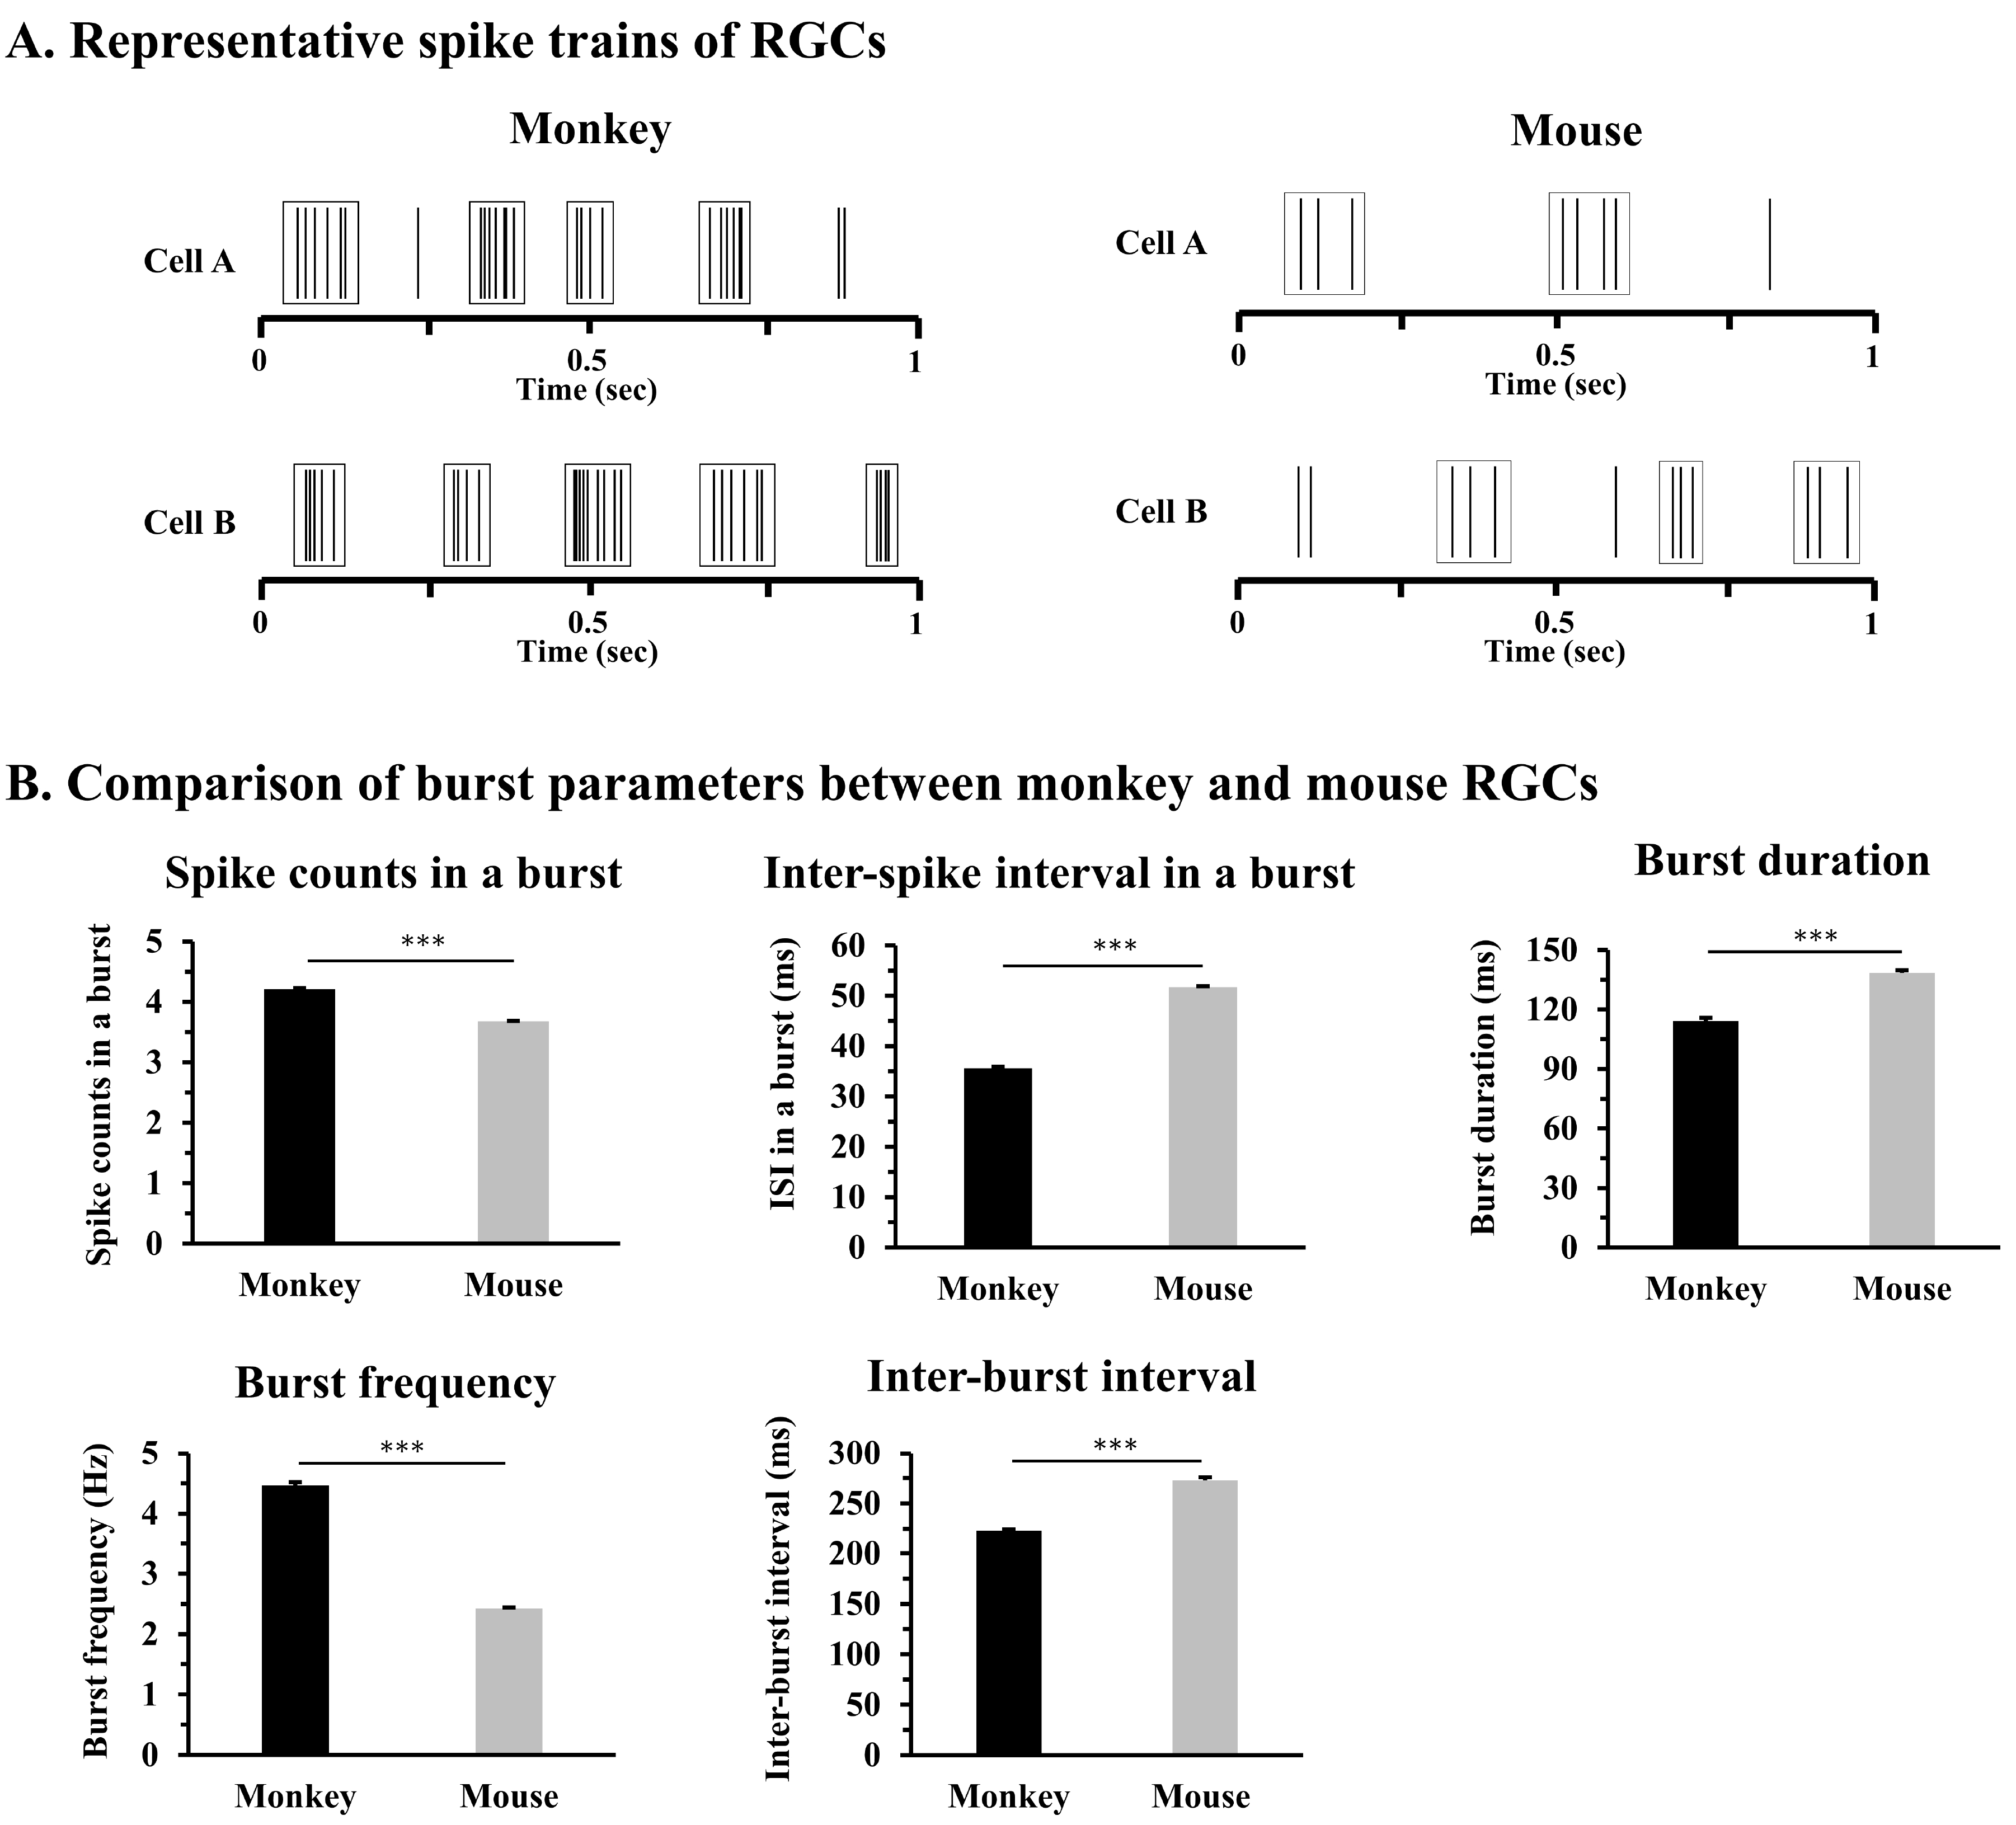
Fig. 2. Bursting activity in monkey and mouse retinas. (A) Representative spike trains of monkey and mouse RGCs. Raster plots show the burst firing of each RGC during one sec. Each solid line represents the timing of the spike. Square boxes indicate each burst of RGCs. (B) Comparison of burst parameters between monkey and mouse retinas: spike counts within a burst, inter-spike interval (ISI) within a burst, burst duration, burst frequency, and interburst interval (IBI). The statistical significance between the two species is shown as an asterisk (***p<0.001).
© Exp Neurobiol