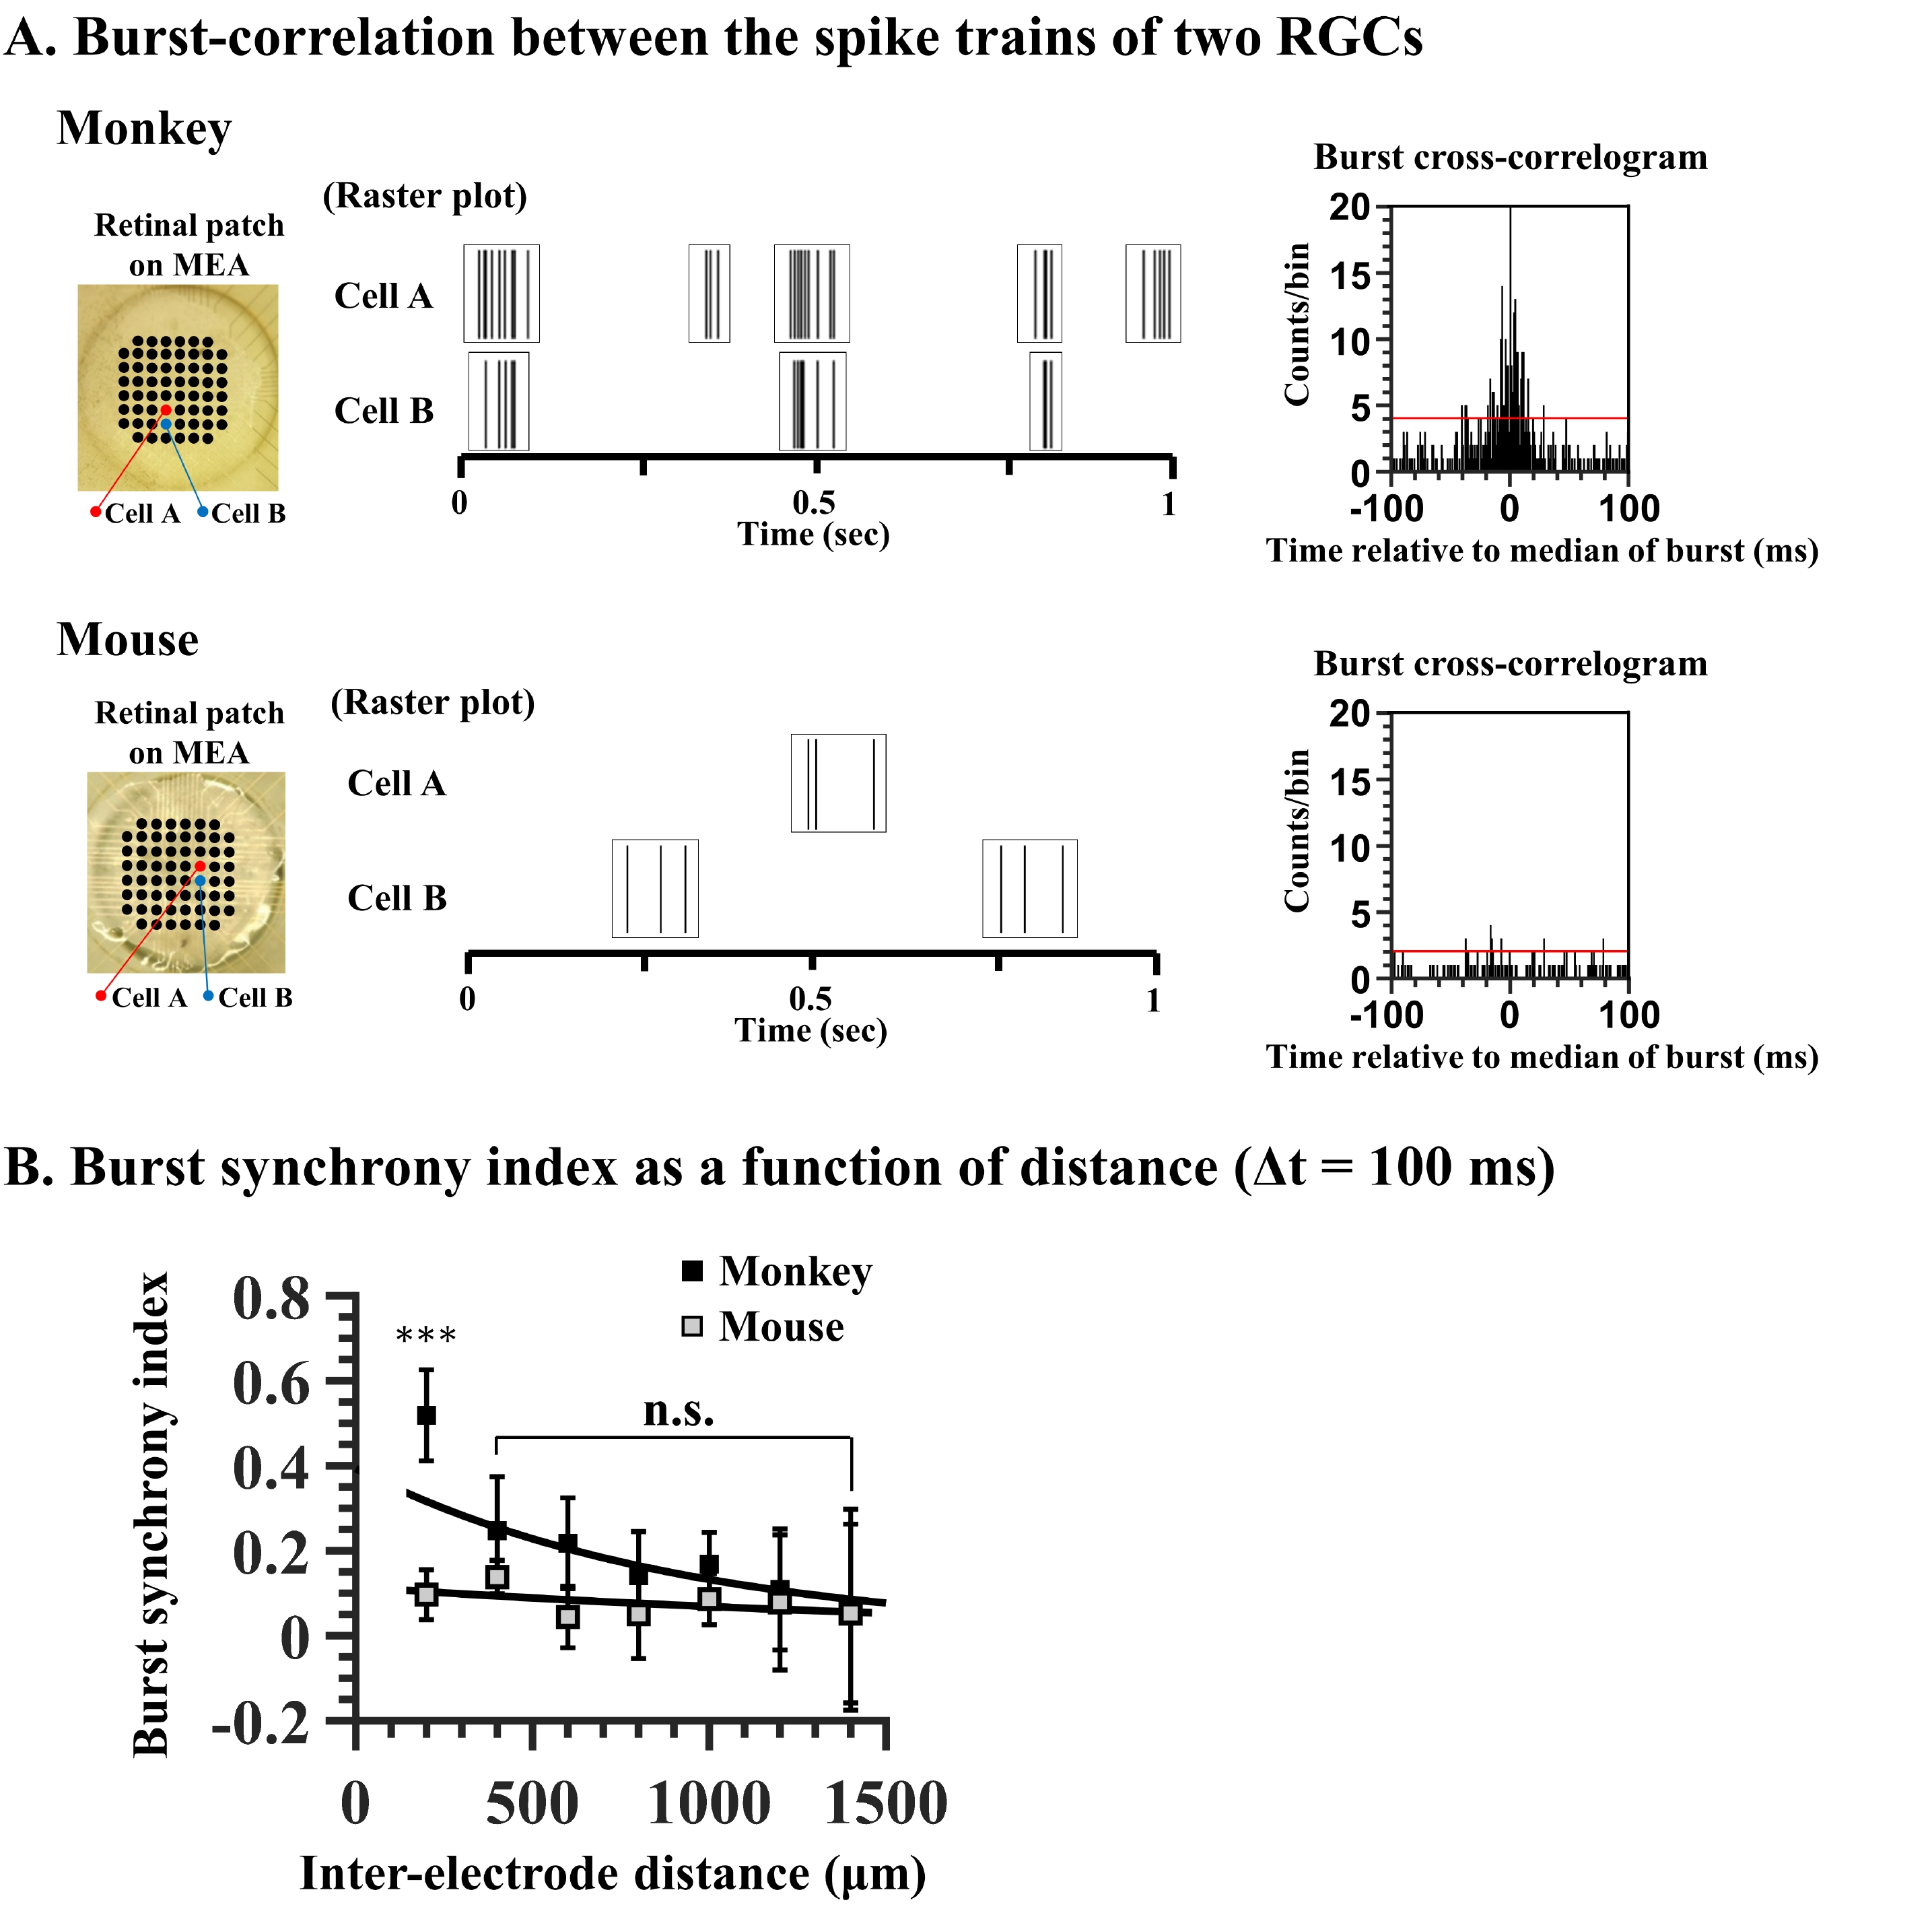
Fig. 3. Synchronized bursting patterns in monkey and mouse retinas. (A) Burst correlation between the spike trains of two RGCs. Left panel: the location of two RGCs with a spacing of 200 μm onto MEA electrodes. Two pictures of the retinal patch on MEA are shown. Center panel: burst firing of two RGCs during one sec. Each solid line represents the timing of the spike. Square boxes indicate each burst of RGCs. Right panel: burst cross-correlogram. The time bins of the histograms are selected as 1 ms. The red line indicates the significance level represented by the 99% confidence limit of the time histogram. (B) burst synchrony index (BSI) as a function of inter-electrode distance. The time interval is chosen to be 100 ms. The statistical difference between monkey and mouse when an inter-electrode distance between two RGCs is 200 μm apart is shown as an asterisk (***p<0.001).
© Exp Neurobiol