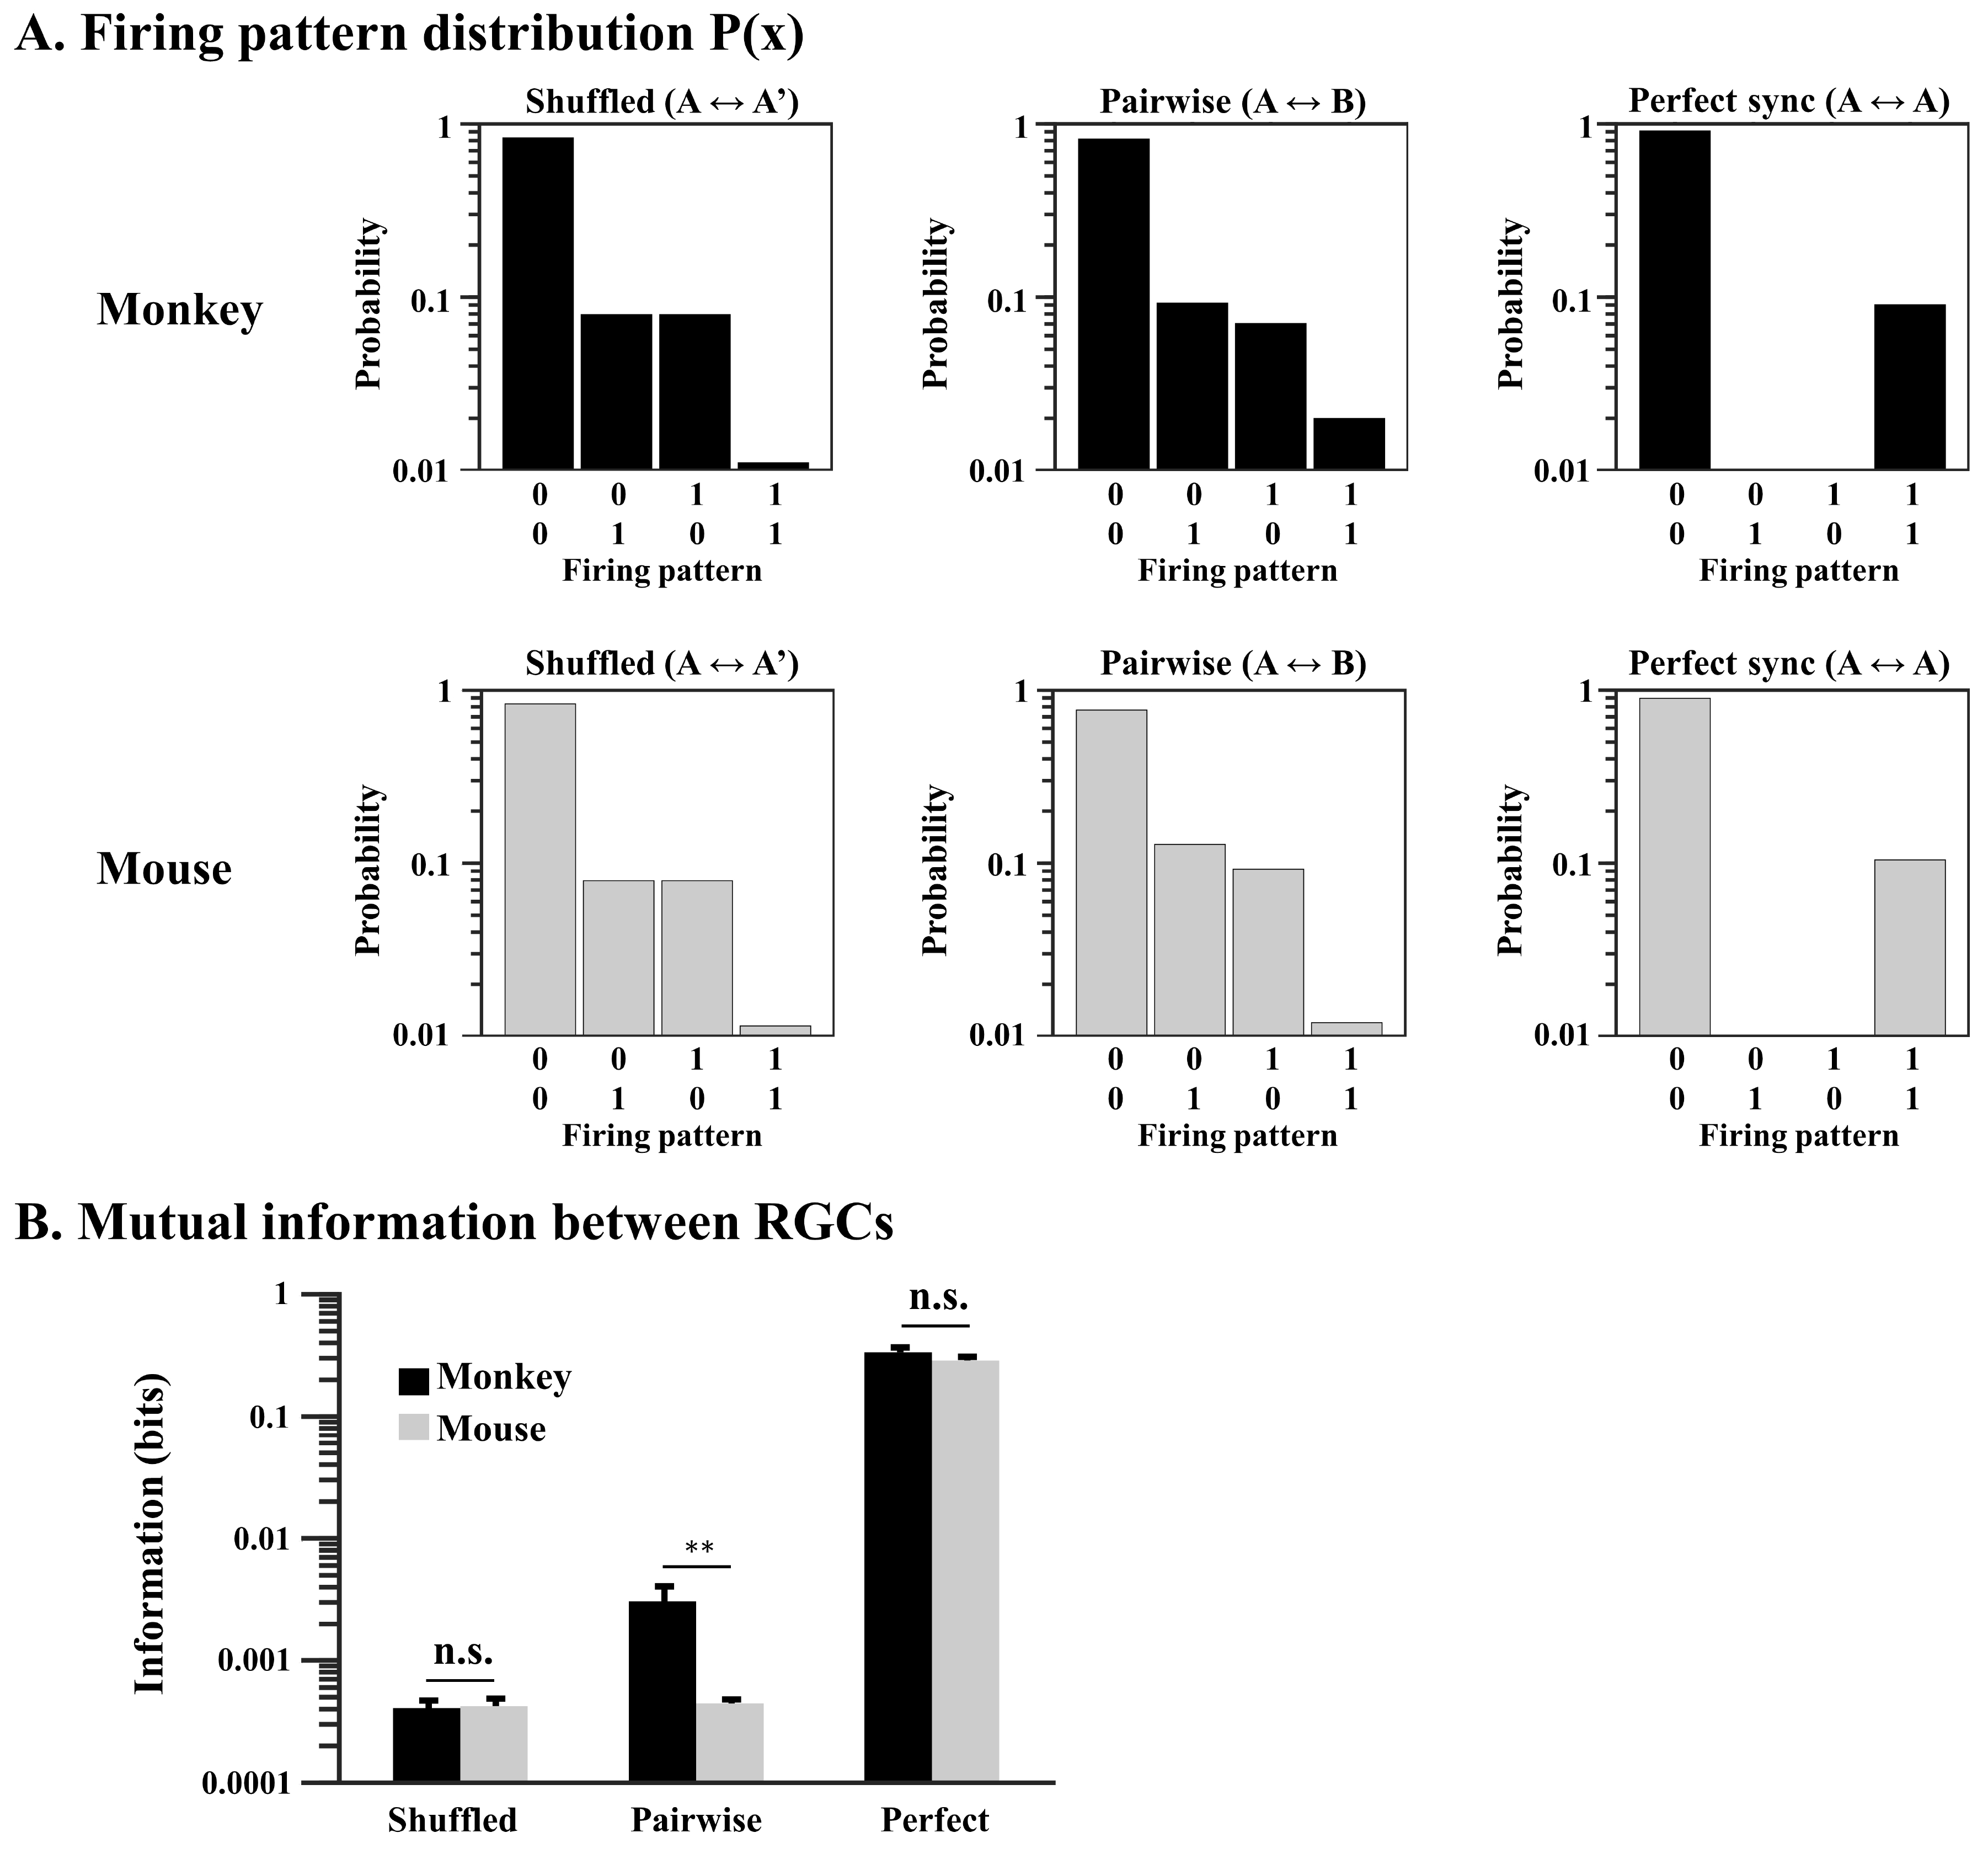
Fig. 4. Mutual information between RGCs in monkey and mouse. (A) Firing pattern distribution for pairwise RGCs with 200 μm spacing between electrodes. Each distribution is represented by a histogram. The firing pattern is expressed in binary digits on the horizontal coordinate, indicating a burst (1) or no burst (0) in each cell. The probability of the vertical coordinate is noted on a logarithmic scale. Firing pattern distributions were obtained from shuffled data, pairwise data, and perfectly synchronized data. (B) Mutual information between a pair of RGCs. The statistical significance between the two species was shown as an asterisk (**p<0.01).
© Exp Neurobiol