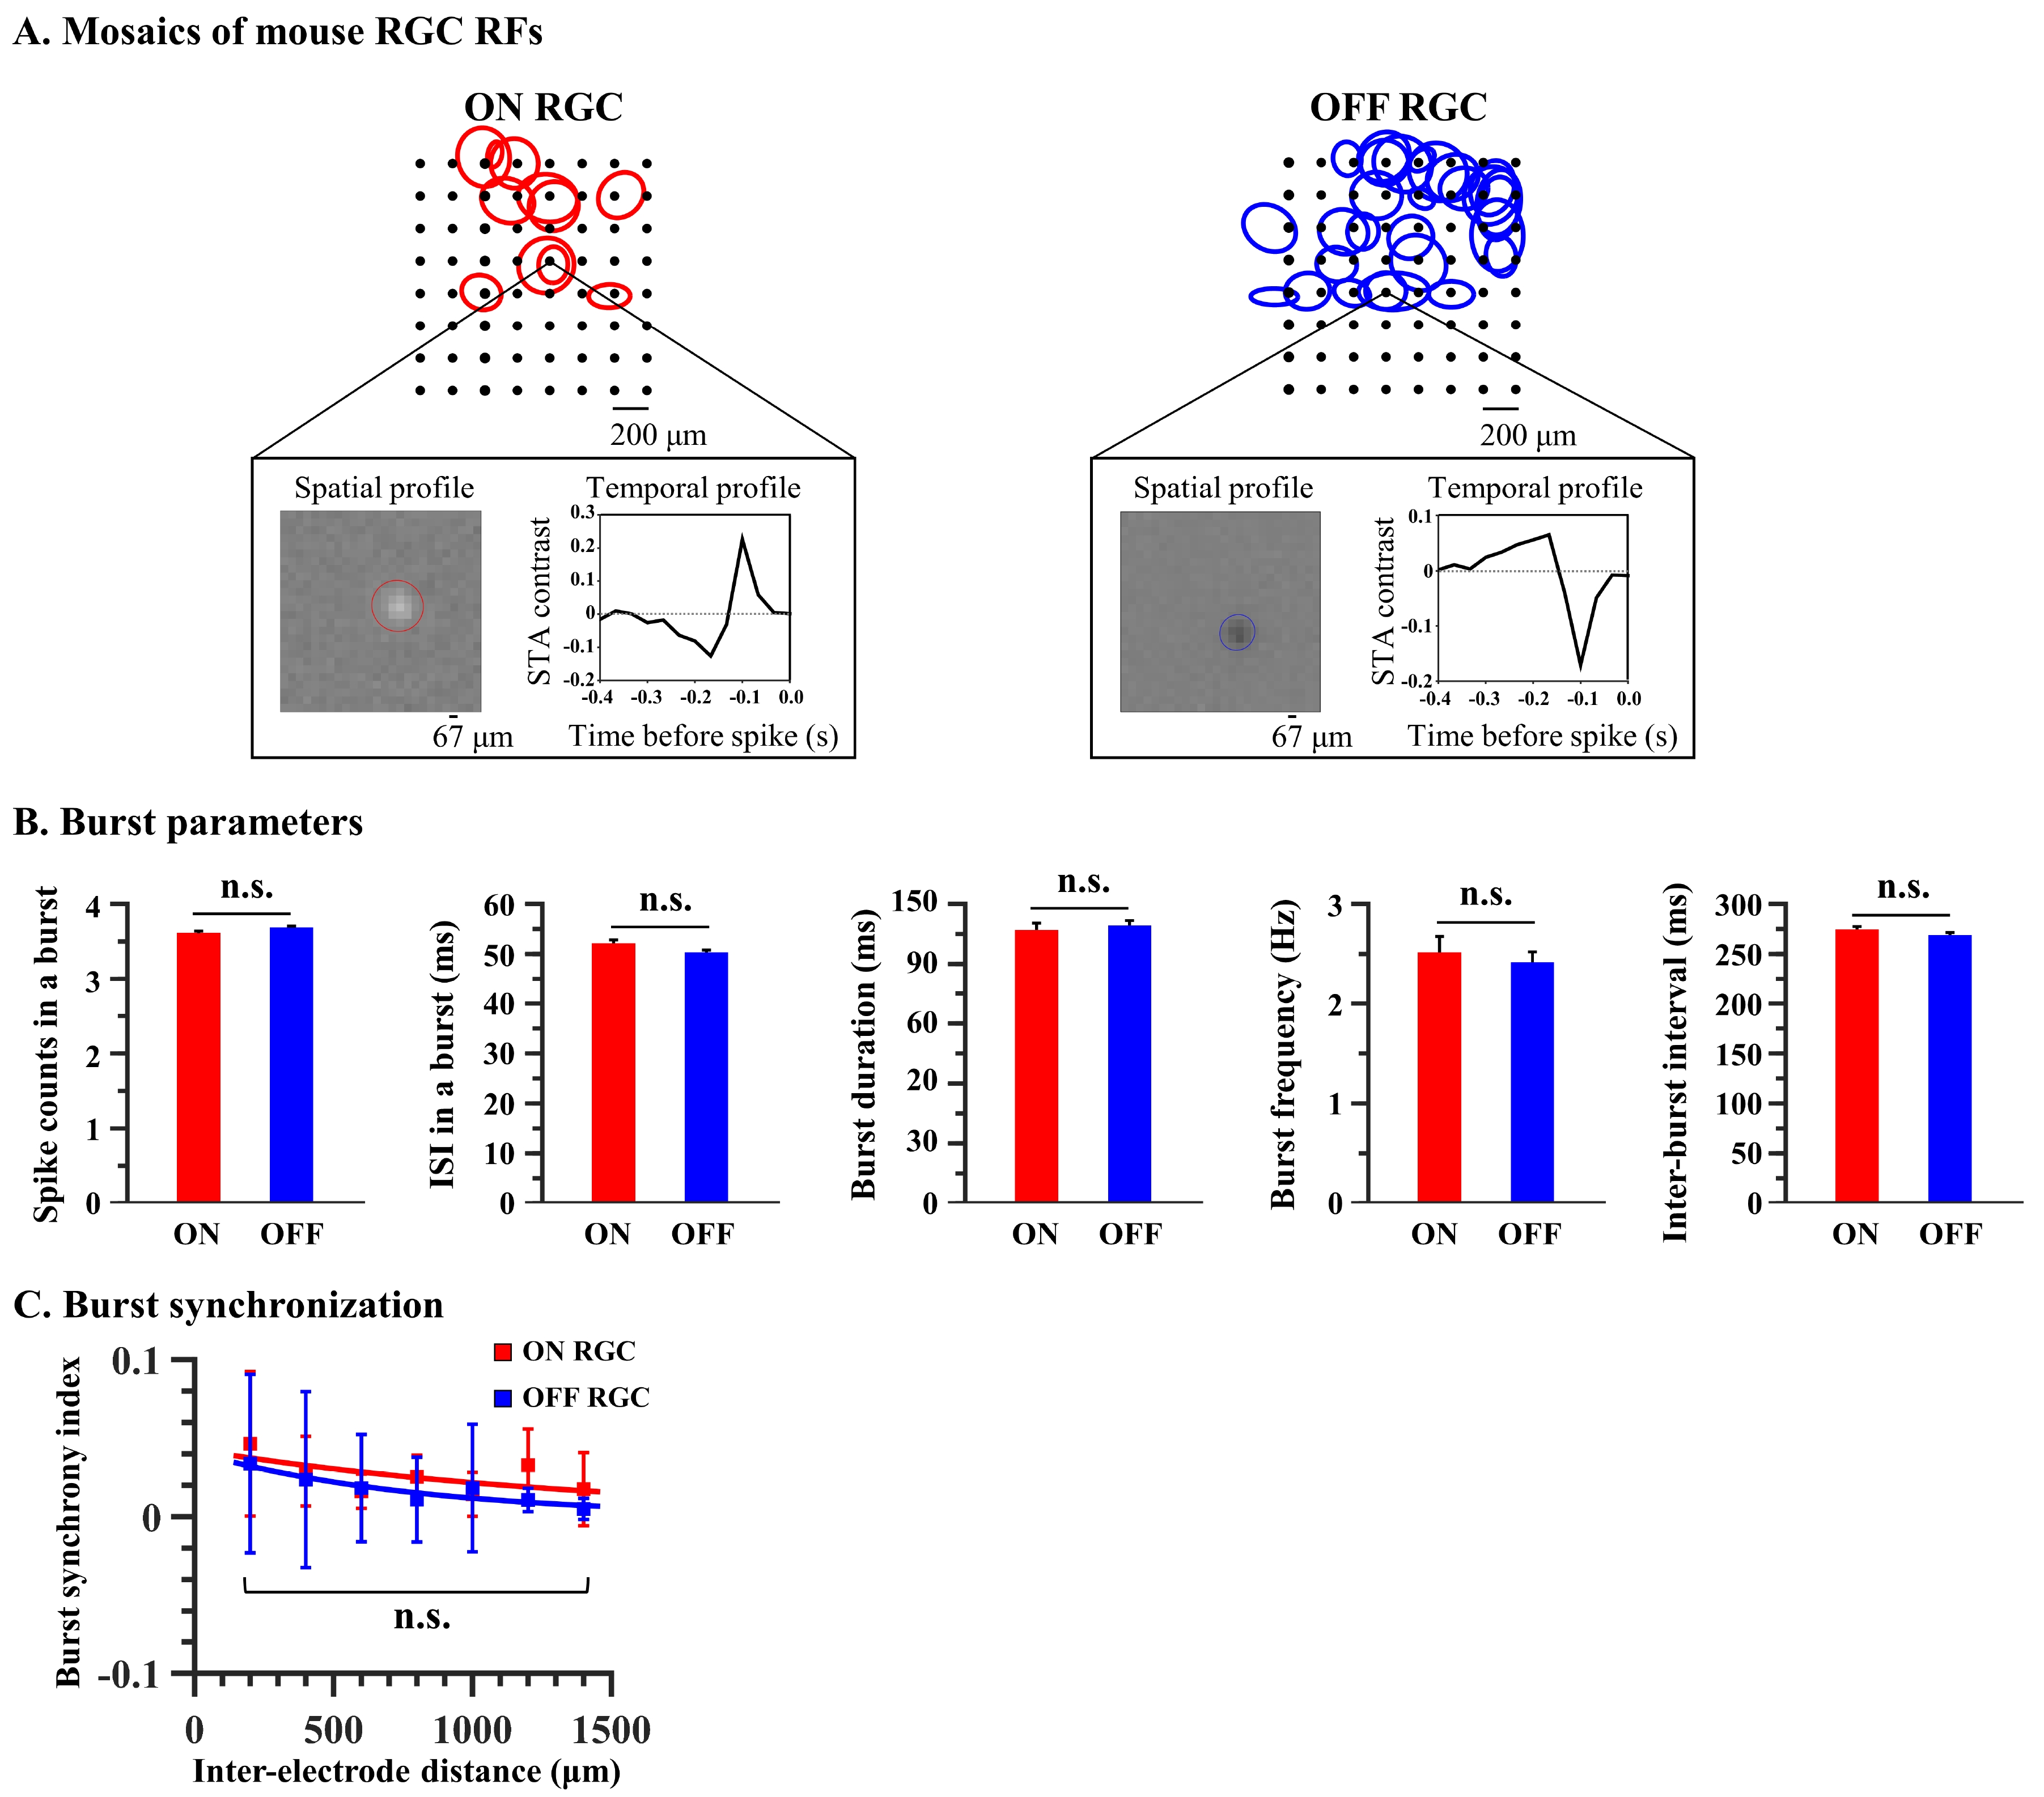
Fig. 5. Spontaneous bursting activity for the ON and OFF RGCs. (A) Top: mosaics of receptive fields (RFs) of RGCs reconstructed in each retinal patch from mouse are superimposed on the 8×8 electrodes; Bottom left: The spatial maps of STA from a selected electrode of MEA (electrode number of ON RGC in the mouse: 54, OFF RGC: 45). The RFs from spatial maps were fit to ellipse using two-dimensional Gaussian (ON RGC: red ellipse, OFF RGC: blue ellipse); Bottom right: The temporal profile of the maximum contrast pixel of 26×26 pixels. (B) Comparison of burst parameters between ON and OFF RGCs: spike counts within a burst, inter-spike interval (ISI) within a burst, burst duration, burst frequency, and inter-burst interval (IBI). (C) Burst synchrony index (BSI) as a function of inter-electrode distance. There is no statistical difference between mouse ON and OFF RGCs.
© Exp Neurobiol