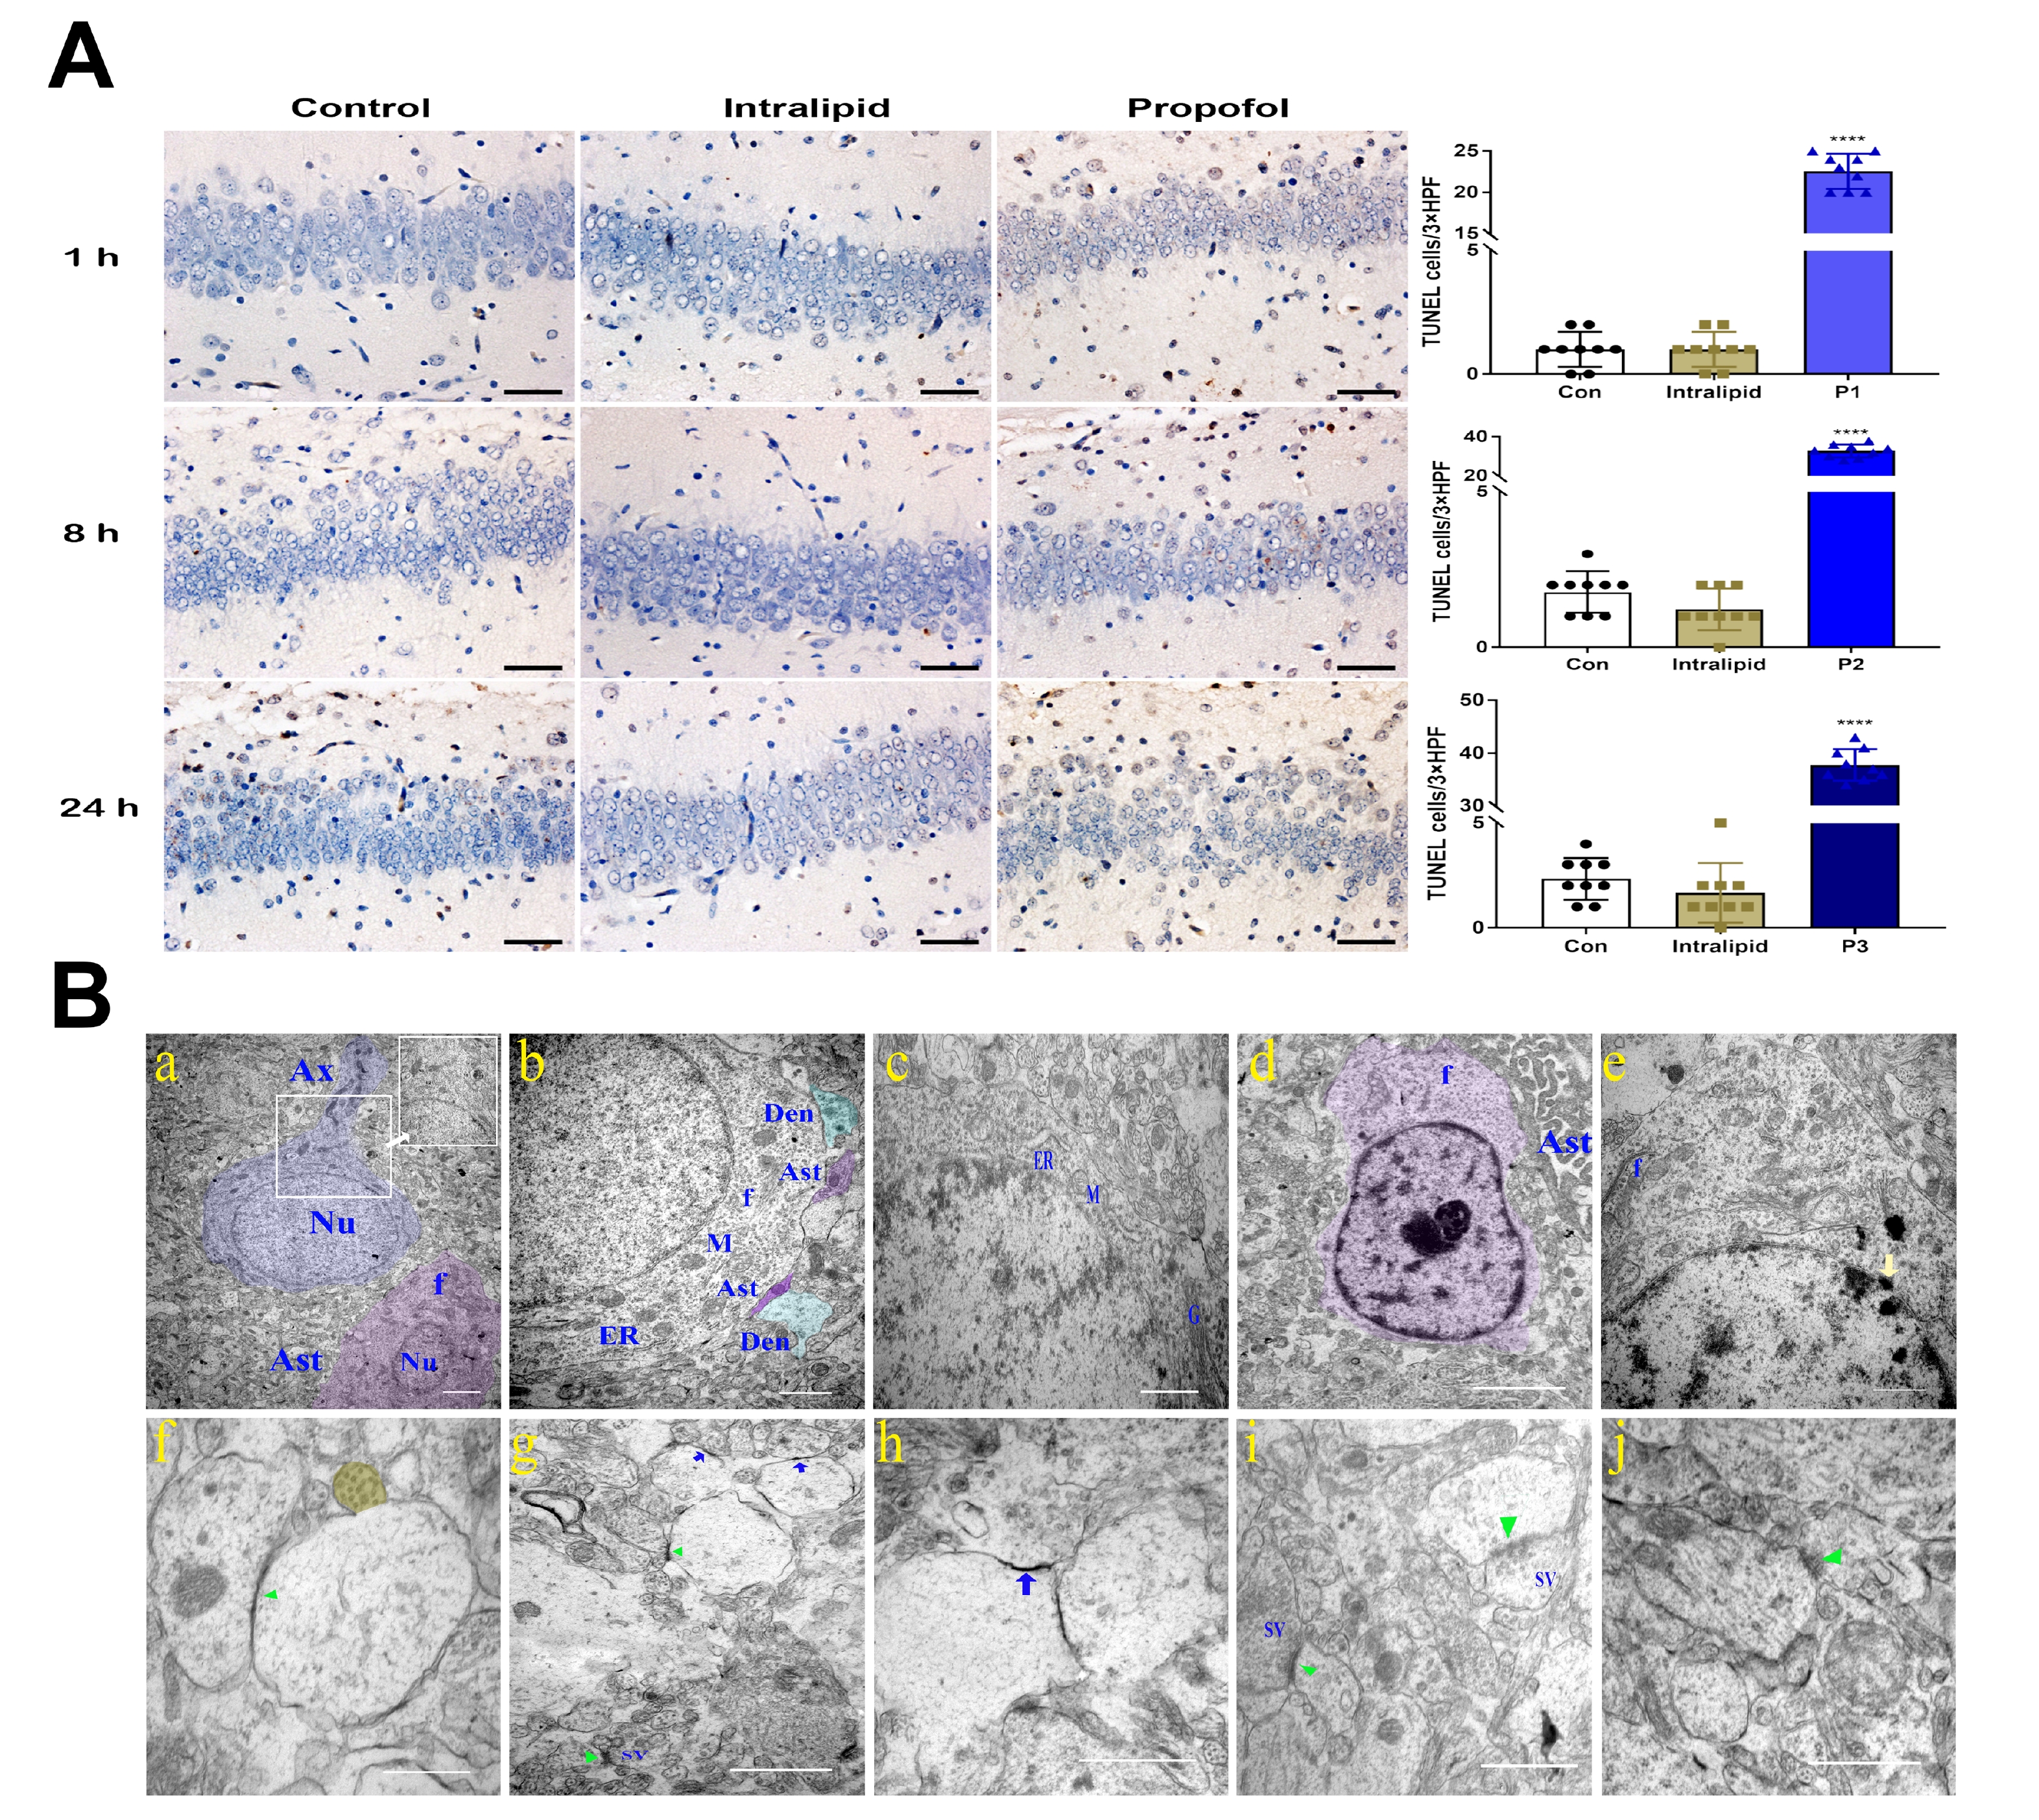
Fig. 2. Effect of neonatal propofol exposure on immature hippocampal neurocytes and synapse. (A) TUNEL staining showing the number of apoptotic cells, n=9 slices per group, from three rats. Scale bar=50 μm. (B) TEM images of the rodent hippocampi. After termination of the 1-, 8- and 24-hour exposure to 30 mg/kg propofol, which was designed as P1, P2 and P3 group, hippocampal ultrastructure was evaluated under a scanning TEM. (a) Neurons (blue) and astrocytes (Ast, purple) in the control group. Axon, Ax; filament, f; nucleus, Nu. Scale bar=2 μm, 1 μm in the right upper rectangle (magnified picture). (b) In the intralipid group, dendrite (Den, blue), endoplasmic reticulum (ER), and mitochondria (M) are visible. Scale bar=1 μm. (c) In the P1 group, M shows homogeneous densities with relatively well-shaped cristae, occasionally with vacuoles inside. Some rough ER is swollen. Golgi apparatus, G. Scale bar=1 μm. (d) In the P2 group, Ast (purple) containing multiple f and an obvious condensed nuclear chromatin with intact nuclear envelop is highlighted. Scale bar=2 μm. (e) Destruction of nuclear membrane in the P3 group (yellow arrow). Scale bar=1 μm. (f) In the control group, the synaptic ultra-structural morphology of rodent hippocampal CA1 regions was intact with clear synaptic vesicles (SVs, yellow), green arrow heads: asymmetric synapse. Scale bar=500 nm. (g) In the intralipid group, both asymmetric (green arrowheads) and symmetric synapses (blue arrow) with dense postsynaptic density (PSD) are shown. Scale bar=1 μm. (h) In the P1 group, the synaptic ultrastructure is still complete with fewer SVs. Scale bar=1 μm. (i) In the P2 group, the synaptic cleft is obsured but still visible PSD. Scale bar=1 μm. (j) In the P3 group, the cleft of the asymmetric synapse (green arrowheads) grew wider with blurred boundaries and fewer SVs. Scale bar=1 μm. n=3 animals per group. All data are presented as mean±SD from three independent experiments. ****p<0.0001 vs. the control group.
© Exp Neurobiol