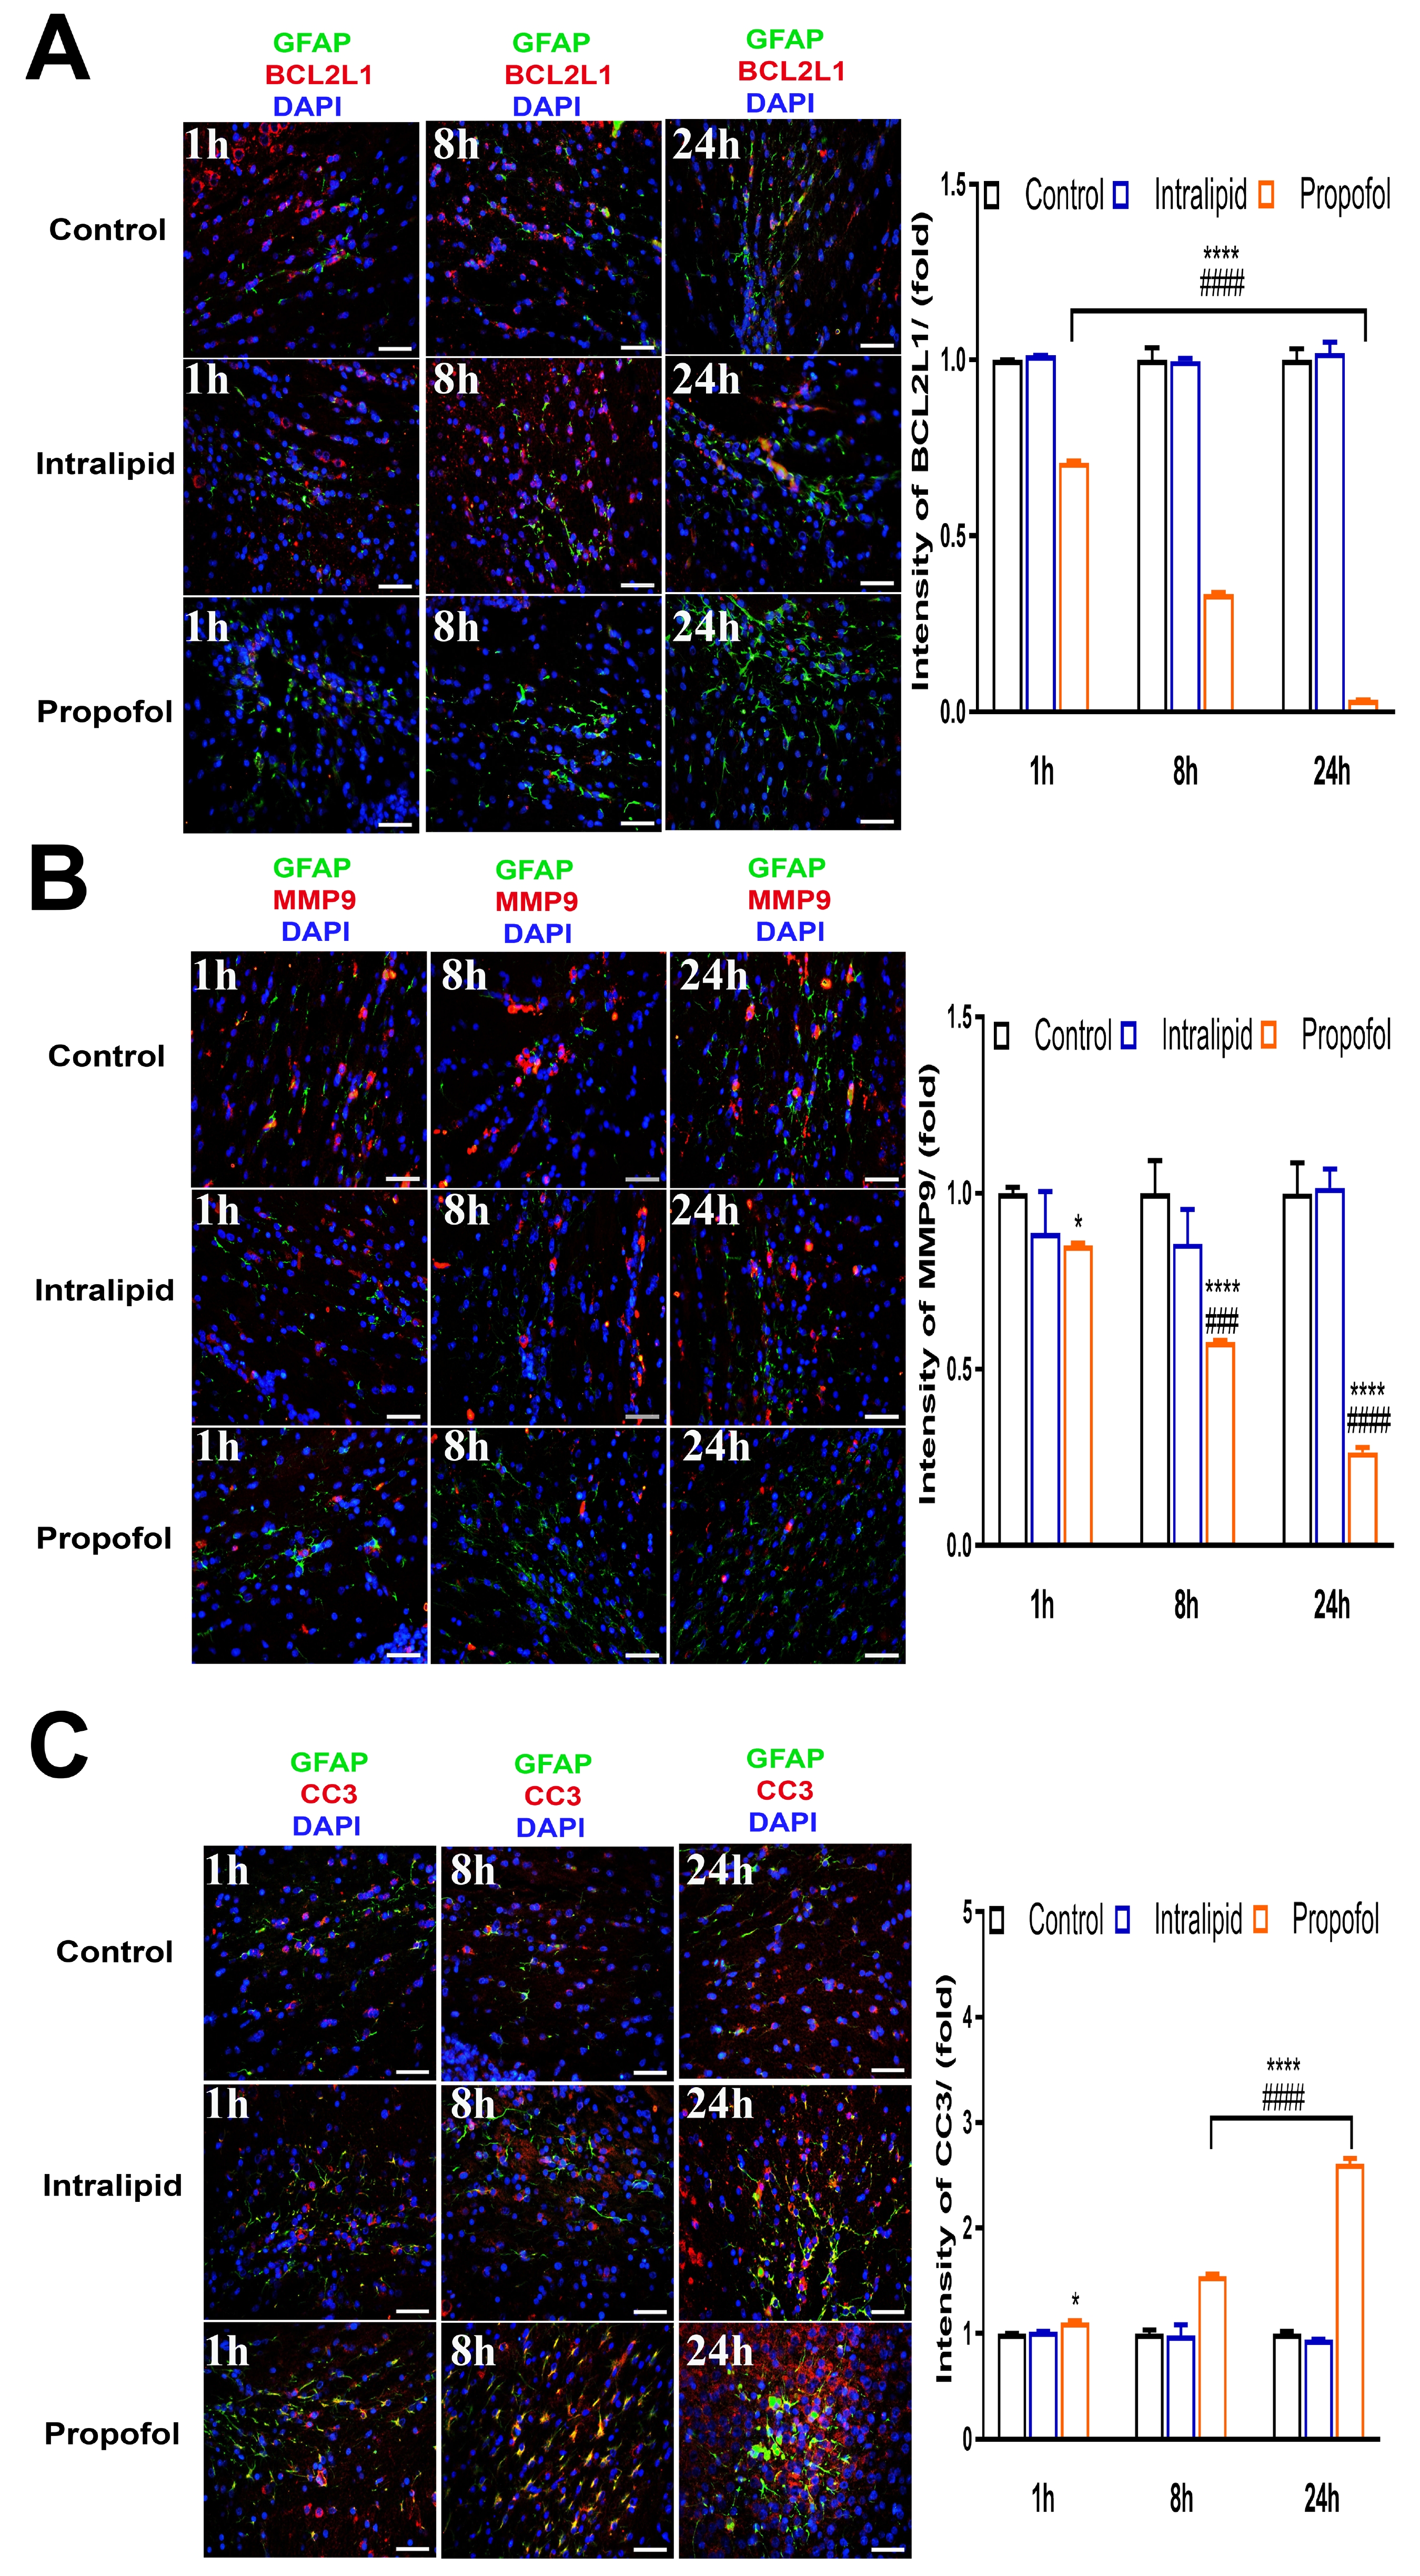
Fig. 4. Double fluorescent micrographs of apoptosis-related genes after exposure to propofol in vivo. (A~C) In vivo immunostaining of hippocampal slices for BCL2L1, CC3 and MMP-9 (all red), with GFAP (green) and DAPI (blue) at 1, 8, 24 h post-injection of 30 mg/kg propofol (P1, P2 and P3 group). Scale bar=50 μm. The graph shows the quantification of fluorescence intensity for the expression of different markers. Results are expressed as multiples relative to the controls (mean±SD). n=3 animals per group. Each test was repeated three times. *p<0.05, **p<0.01, ***p<0.001, ****p<0.0001 vs. the control group. ###p<0.001, ####p<0.0001 vs. intralipid group.
© Exp Neurobiol