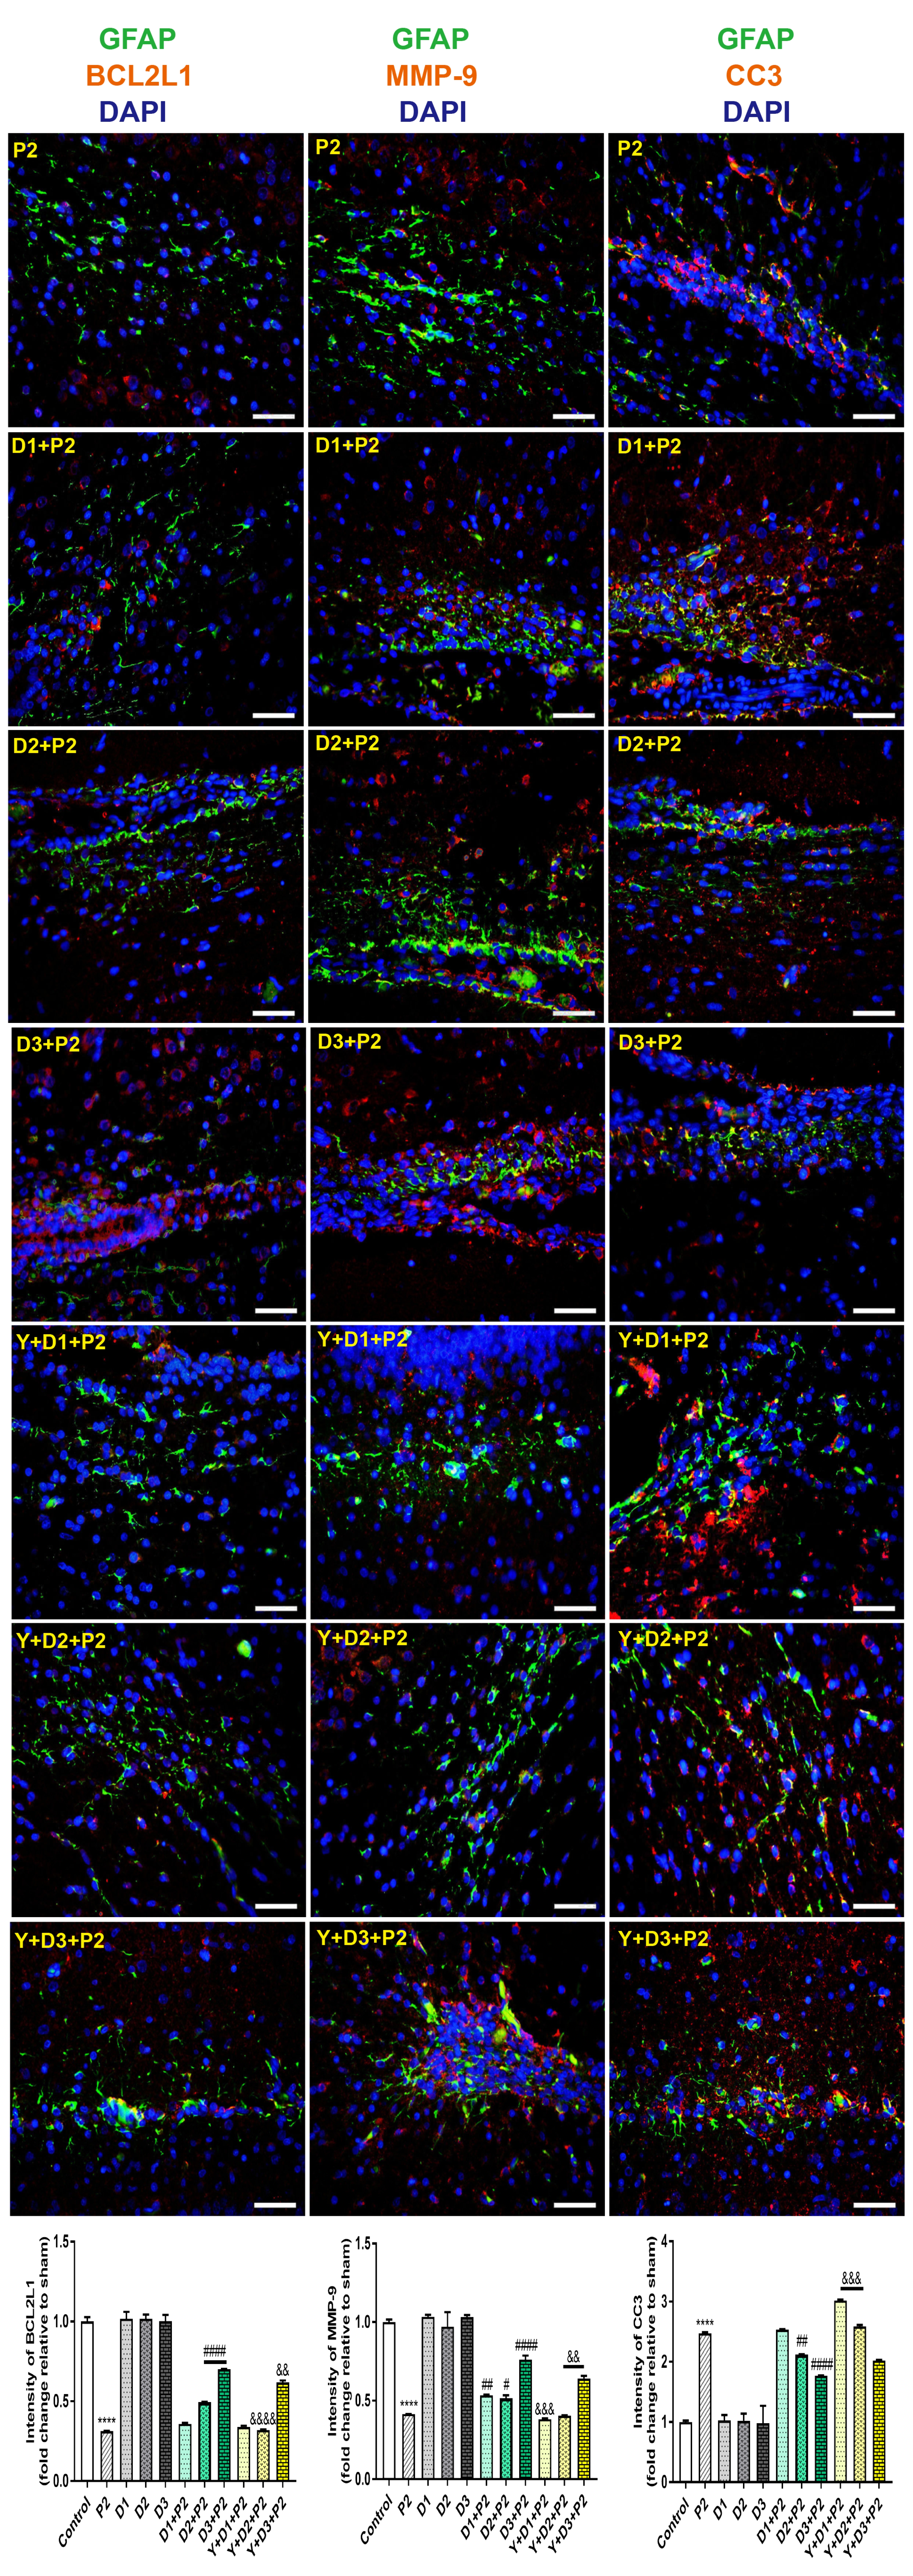
Fig. 7. Double fluorescent micrographs of apoptosis-related genes after exposure to different agents in vivo. The representative double immunofluorescent micrographs and quantitative analysis of the co-localization of GFAP (green) and DAPI (blue) and BCL2L1, MMP-9 and CC3 (all red), as shown in sections representing 8 h exposure to propofol (P2 group), co-exposure to 1, 10, or 20 μg/kg dexmedetomidine (DEX) and propofol (D1/D2/D3+P2 group), or yohimbine and DEX and propofol (Y+D1/D2/D3+P2 group). Scale bar=50 μm. Data are means±SD from three independent experiments. ****p<0.0001 vs. the control group, #p<0.05, ##p<0.01, ####p<0.0001 vs. P2 group, &&p<0.01, &&&p<0.001, &&&&p<0.0001 vs. D1/D2/D3+P2 group.
© Exp Neurobiol


