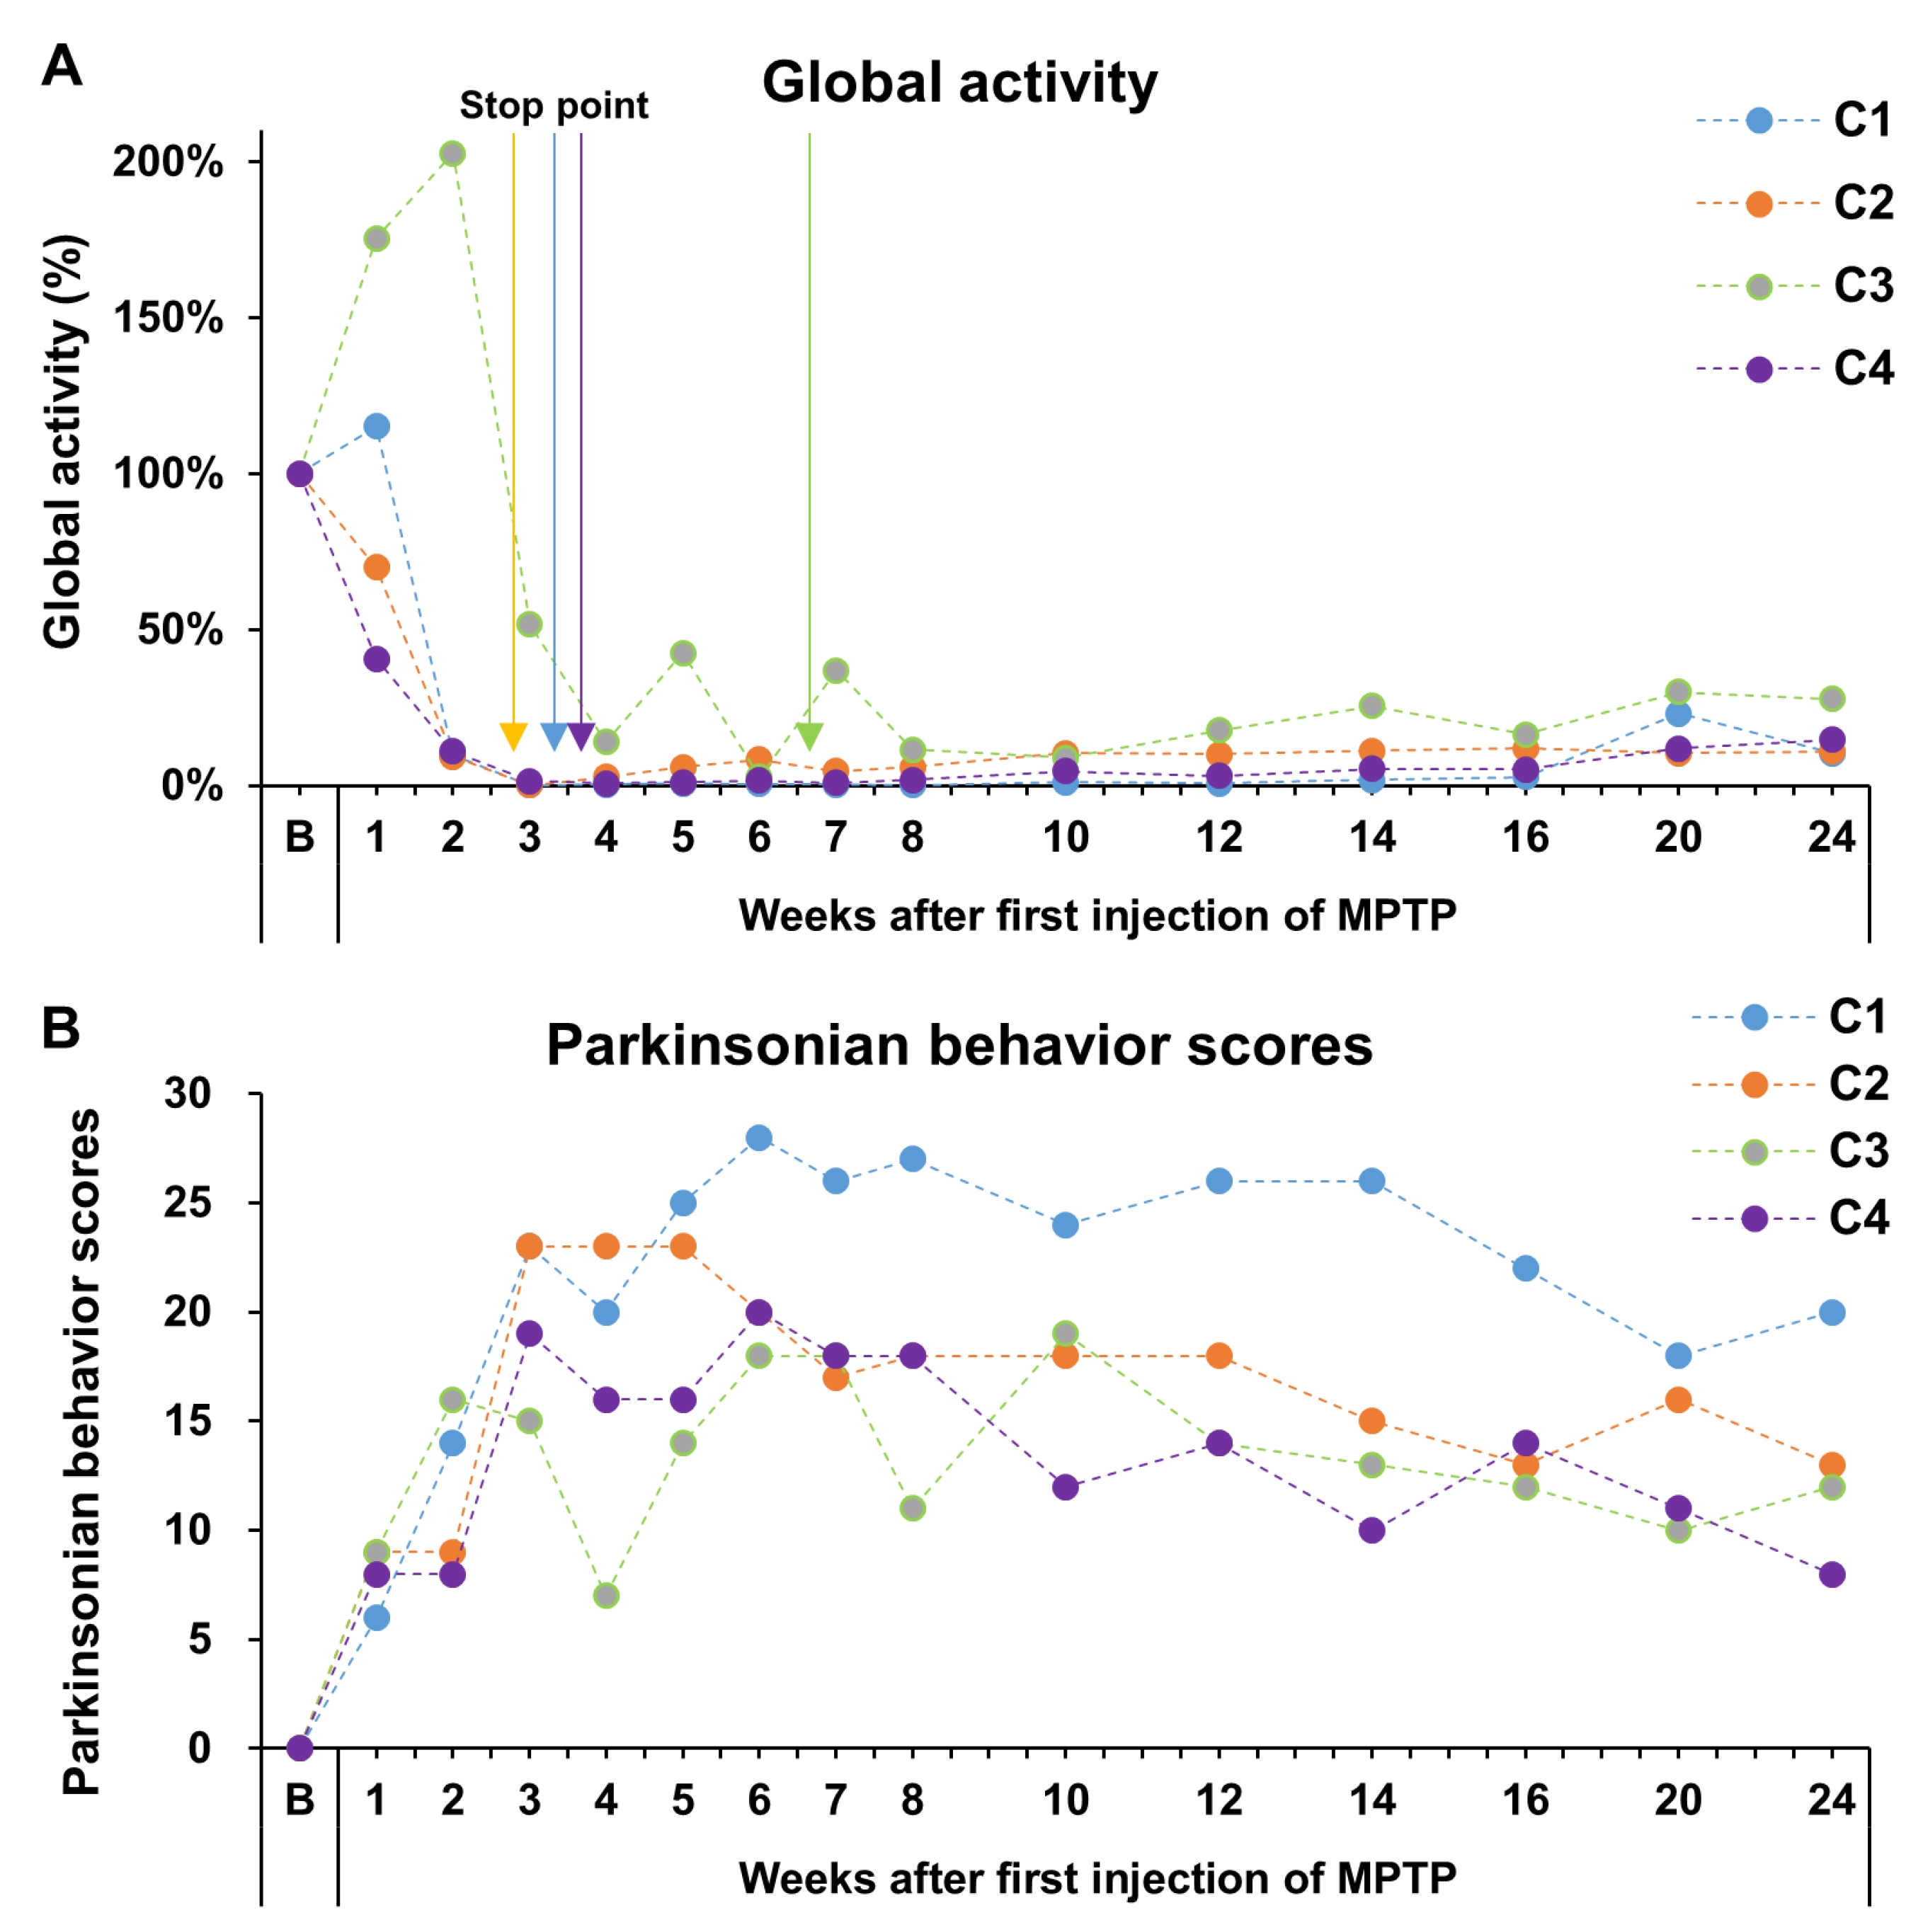
Fig. 4. Four cynomolgus showed PD behavioral signs after MPTP administration. (A) Global activity was reduced after the first MPTP administration. Each cynomolgus response to MPTP differed over time. The total MPTP dose was commensurate to each individual animal’s global activity level. Arrow lines indicate the final timepoint of MPTP injection. (B) Histogram representing Parkinsonian behavior scores shows continuous parkinsonism. (n=4, MPTP injected group; B, baseline).
© Exp Neurobiol