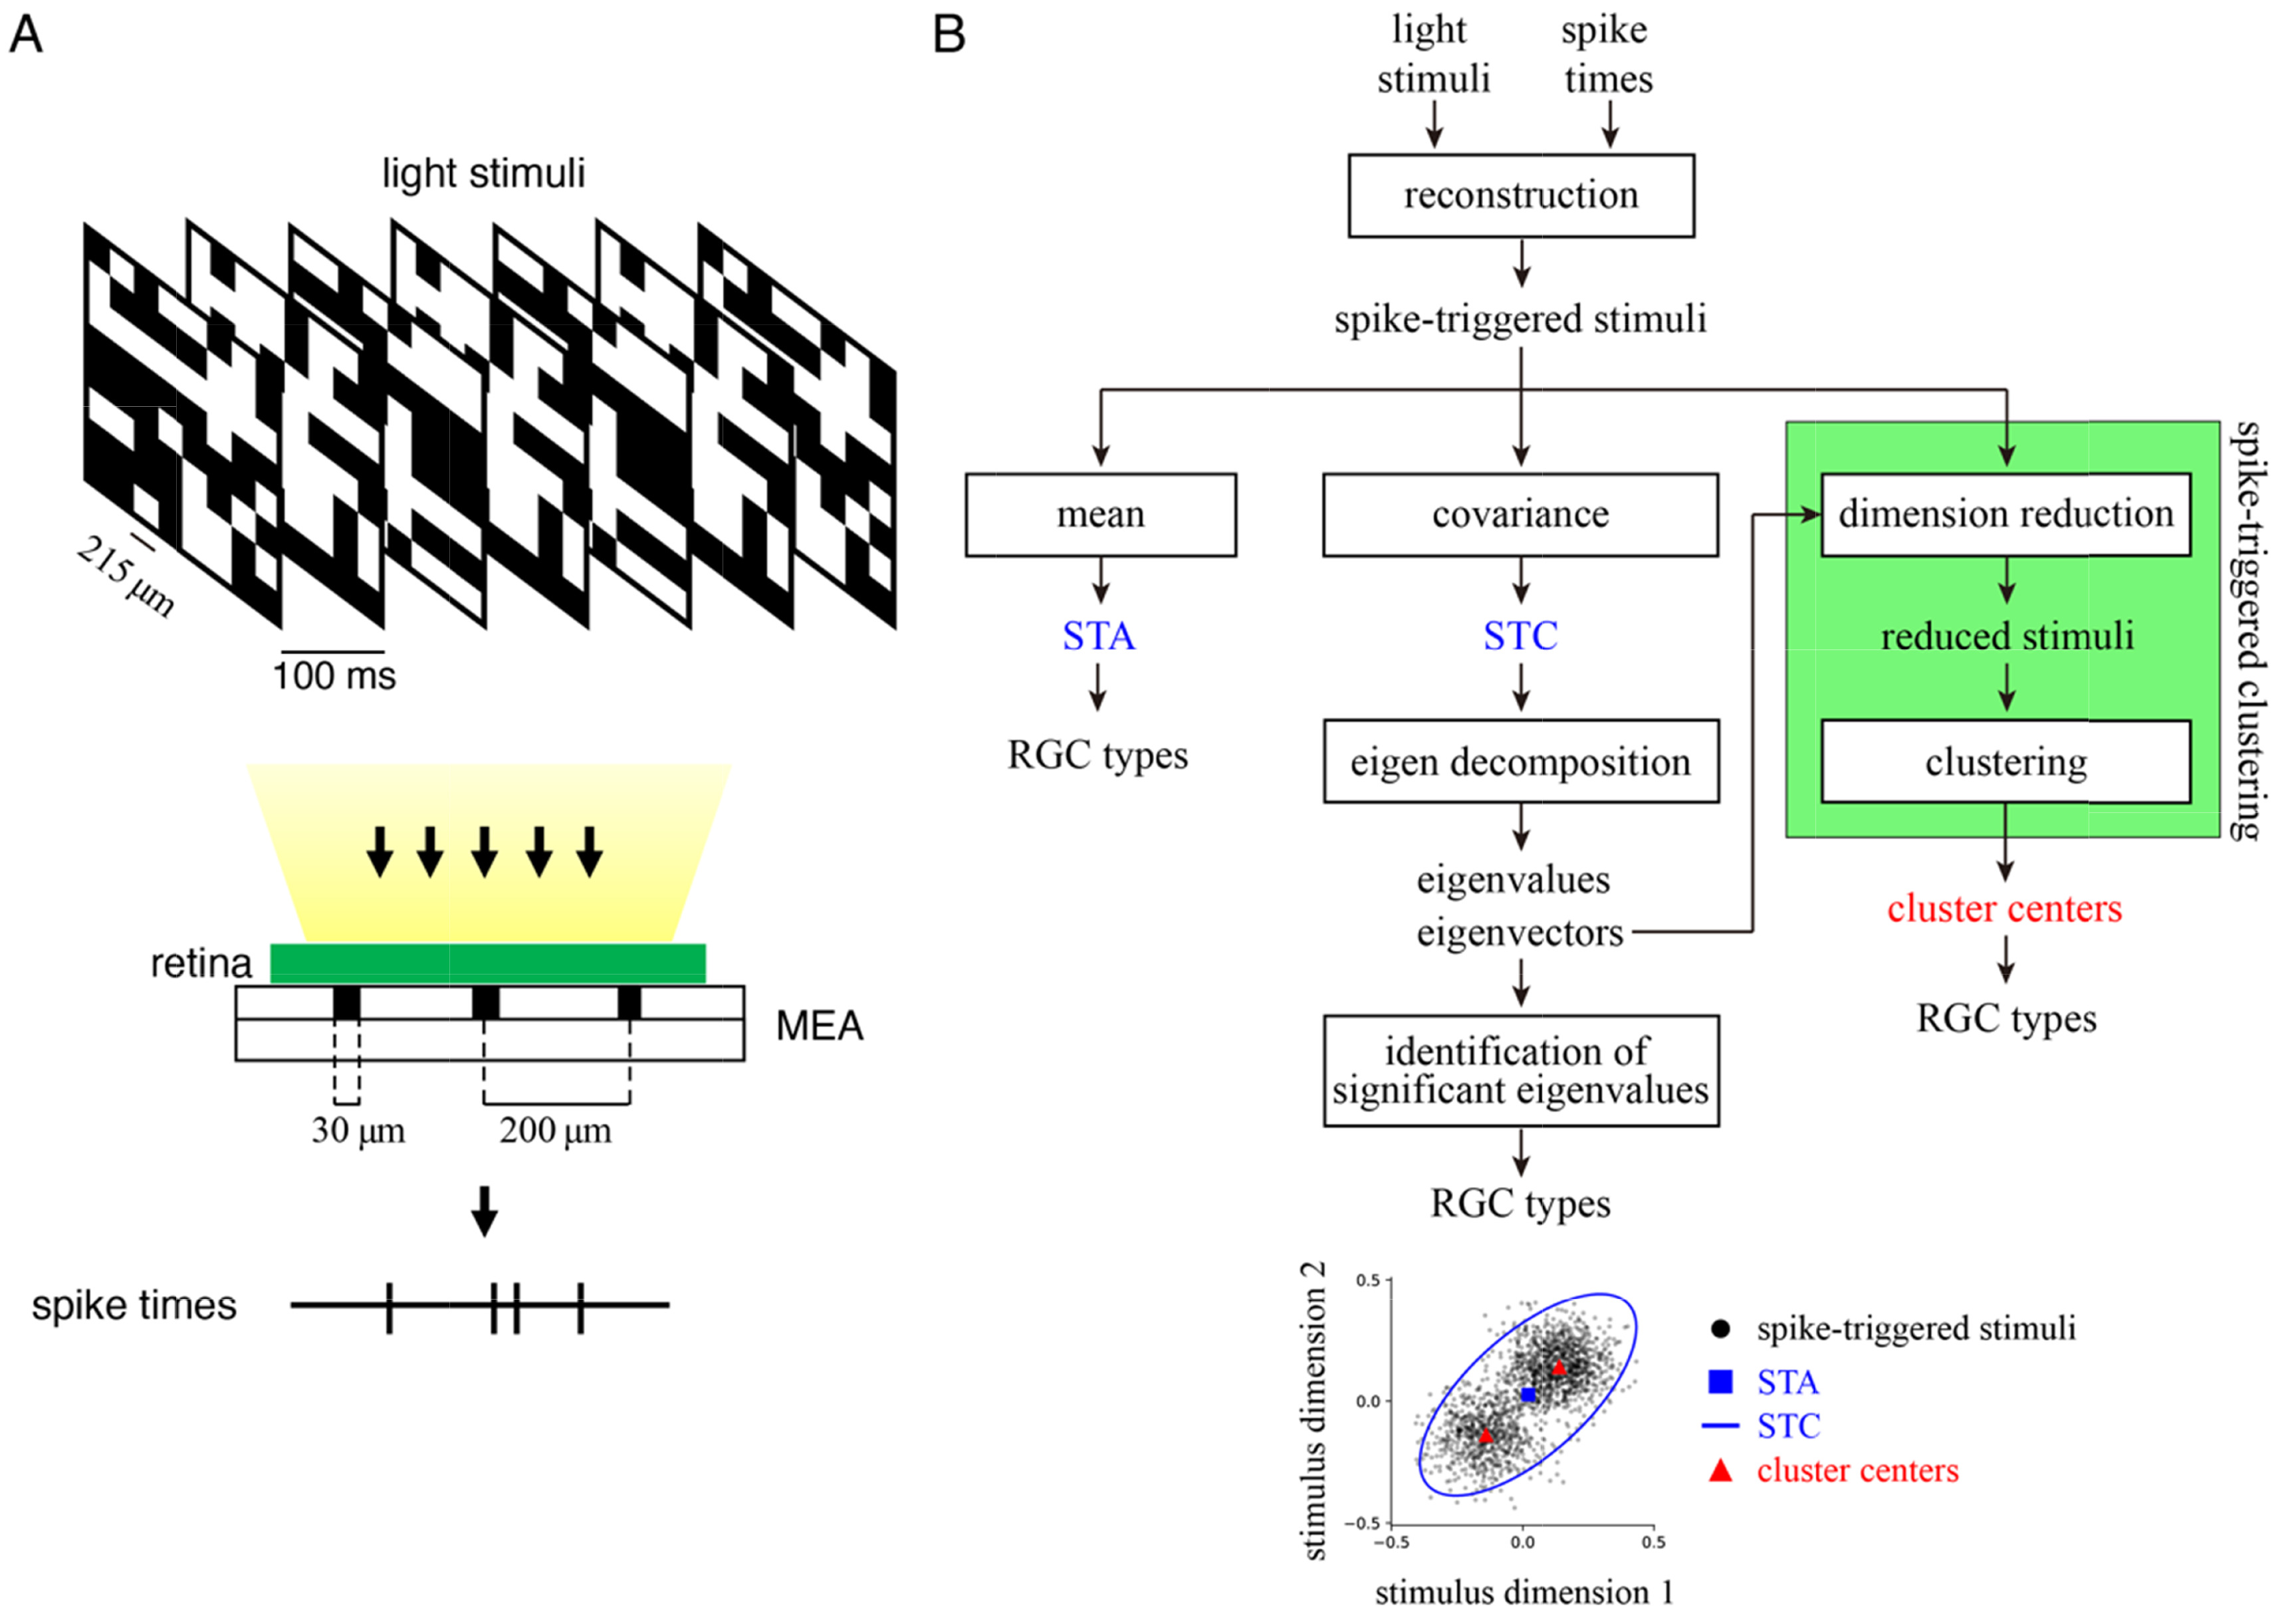
Fig. 1. Experimental setup (A) and the flowchart of STA, STC, and STCL analysis (B). Spike-triggered stimuli for an RGC with both ON and OFF stimulus patterns were numerically generated and visualized as a scatterplot for the first two stimulus dimensions (black dots in B), resulting in two separable groups of spike-triggered stimuli. STA and STC failed to capture this bimodal RF structure because the STA (blue square in B) was far from the two stimulus groups’ actual centers, and the STC (blue ellipse in B) was stretched to include the two stimulus groups. In contrast, spike-triggered clustering analysis correctly identified the centers of the two stimulus groups (red triangle in B).
© Exp Neurobiol