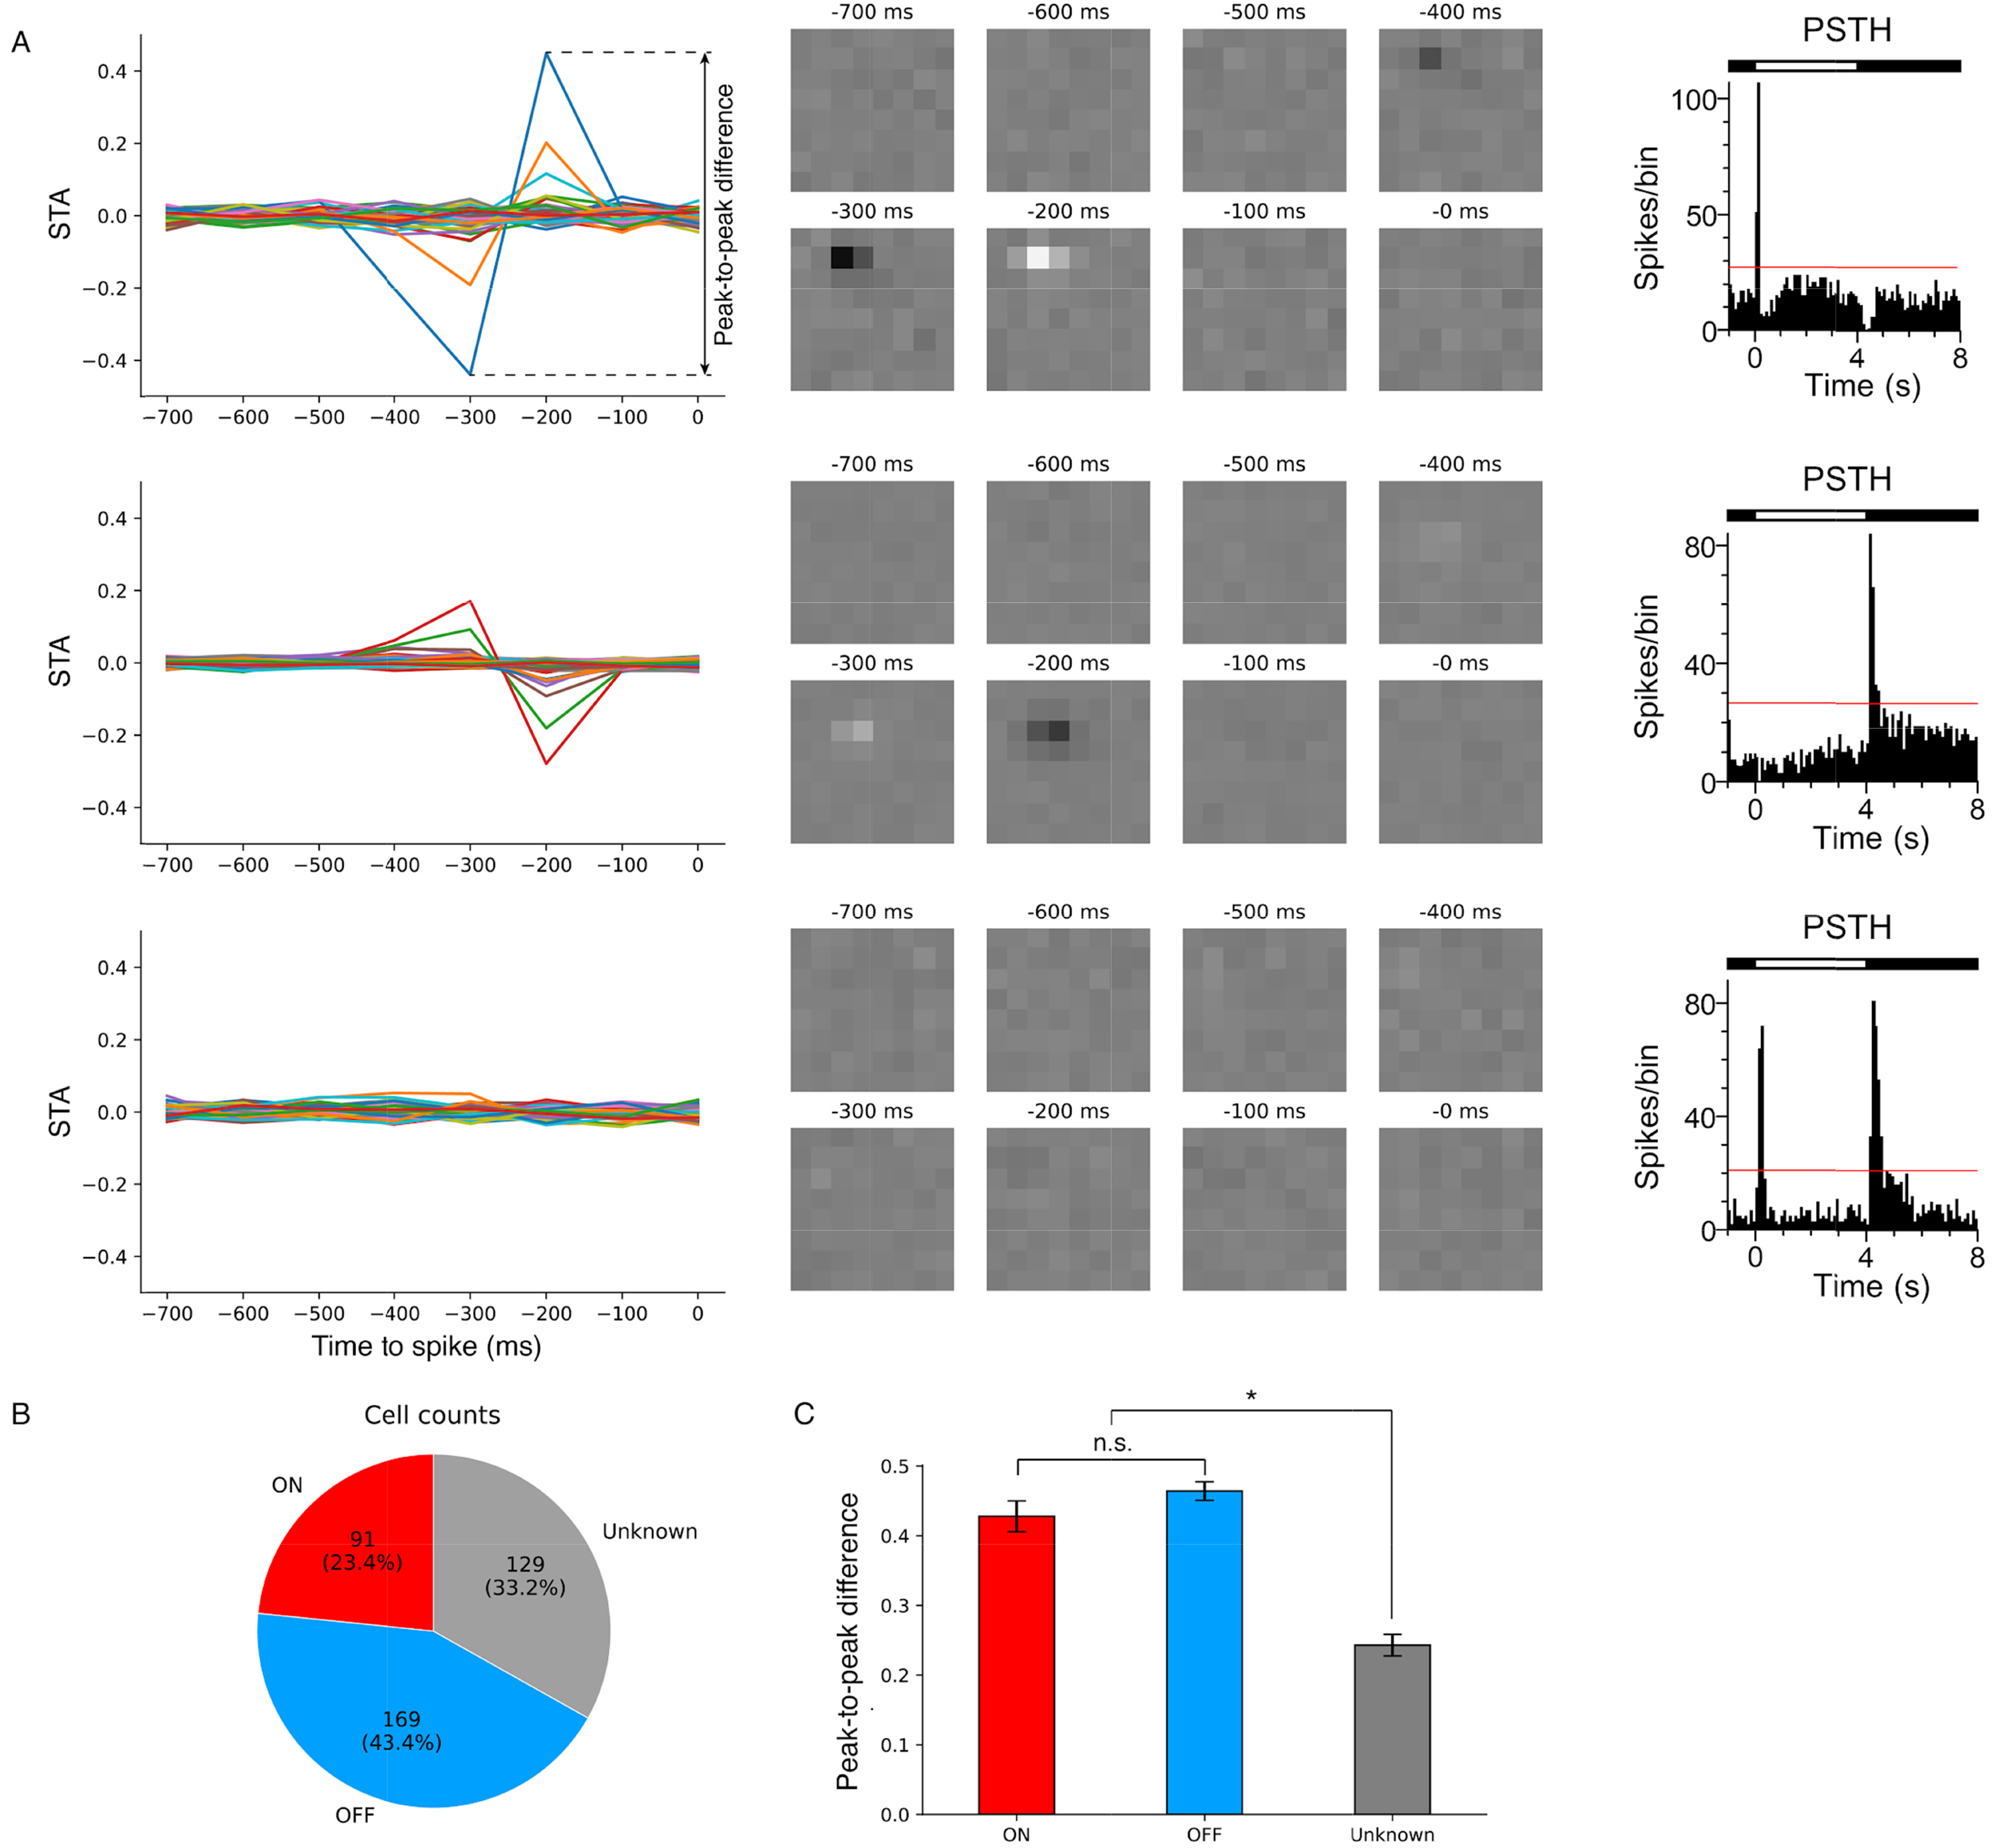
Fig. 2. STA classification of RGC types. (A) STAs of representative RGCs identified as ON (top), OFF (middle), and unknown (bottom) are shown, with the left and middle columns showing the temporal and spatial STA profiles, respectively. In the right column, shown are post-stimulus time histogram (PSTH) graphs of RGC response to full-field illumination of 4 s ON and 4 s OFF duration (time bin: 100 ms). The red horizontal line inside the PSTH graph indicates one-sided 95% confidence interval. The STA of the ON RGC has prominent negative and positive peaks at 300 ms and 200 ms before a spike, respectively (A, top left), which are spatially localized (A, top middle). The STA of the OFF RGC shows similar profiles of ON RGC with opposite polarity (A, middle). In contrast, the STA of the unknown-type RGC (A, bottom) does not contain any noticeable peaks in either of the temporal or spatial profiles. (B) Based on the STAs, 389 RGCs from four retinal patches were classified into 91 ON, 169 OFF, and 129 unknown types. (C) Peak-to-peak differences of unknown-type RGCs are significantly less than those of ON- and OFF-type RGCs, which do not significantly differ.
© Exp Neurobiol