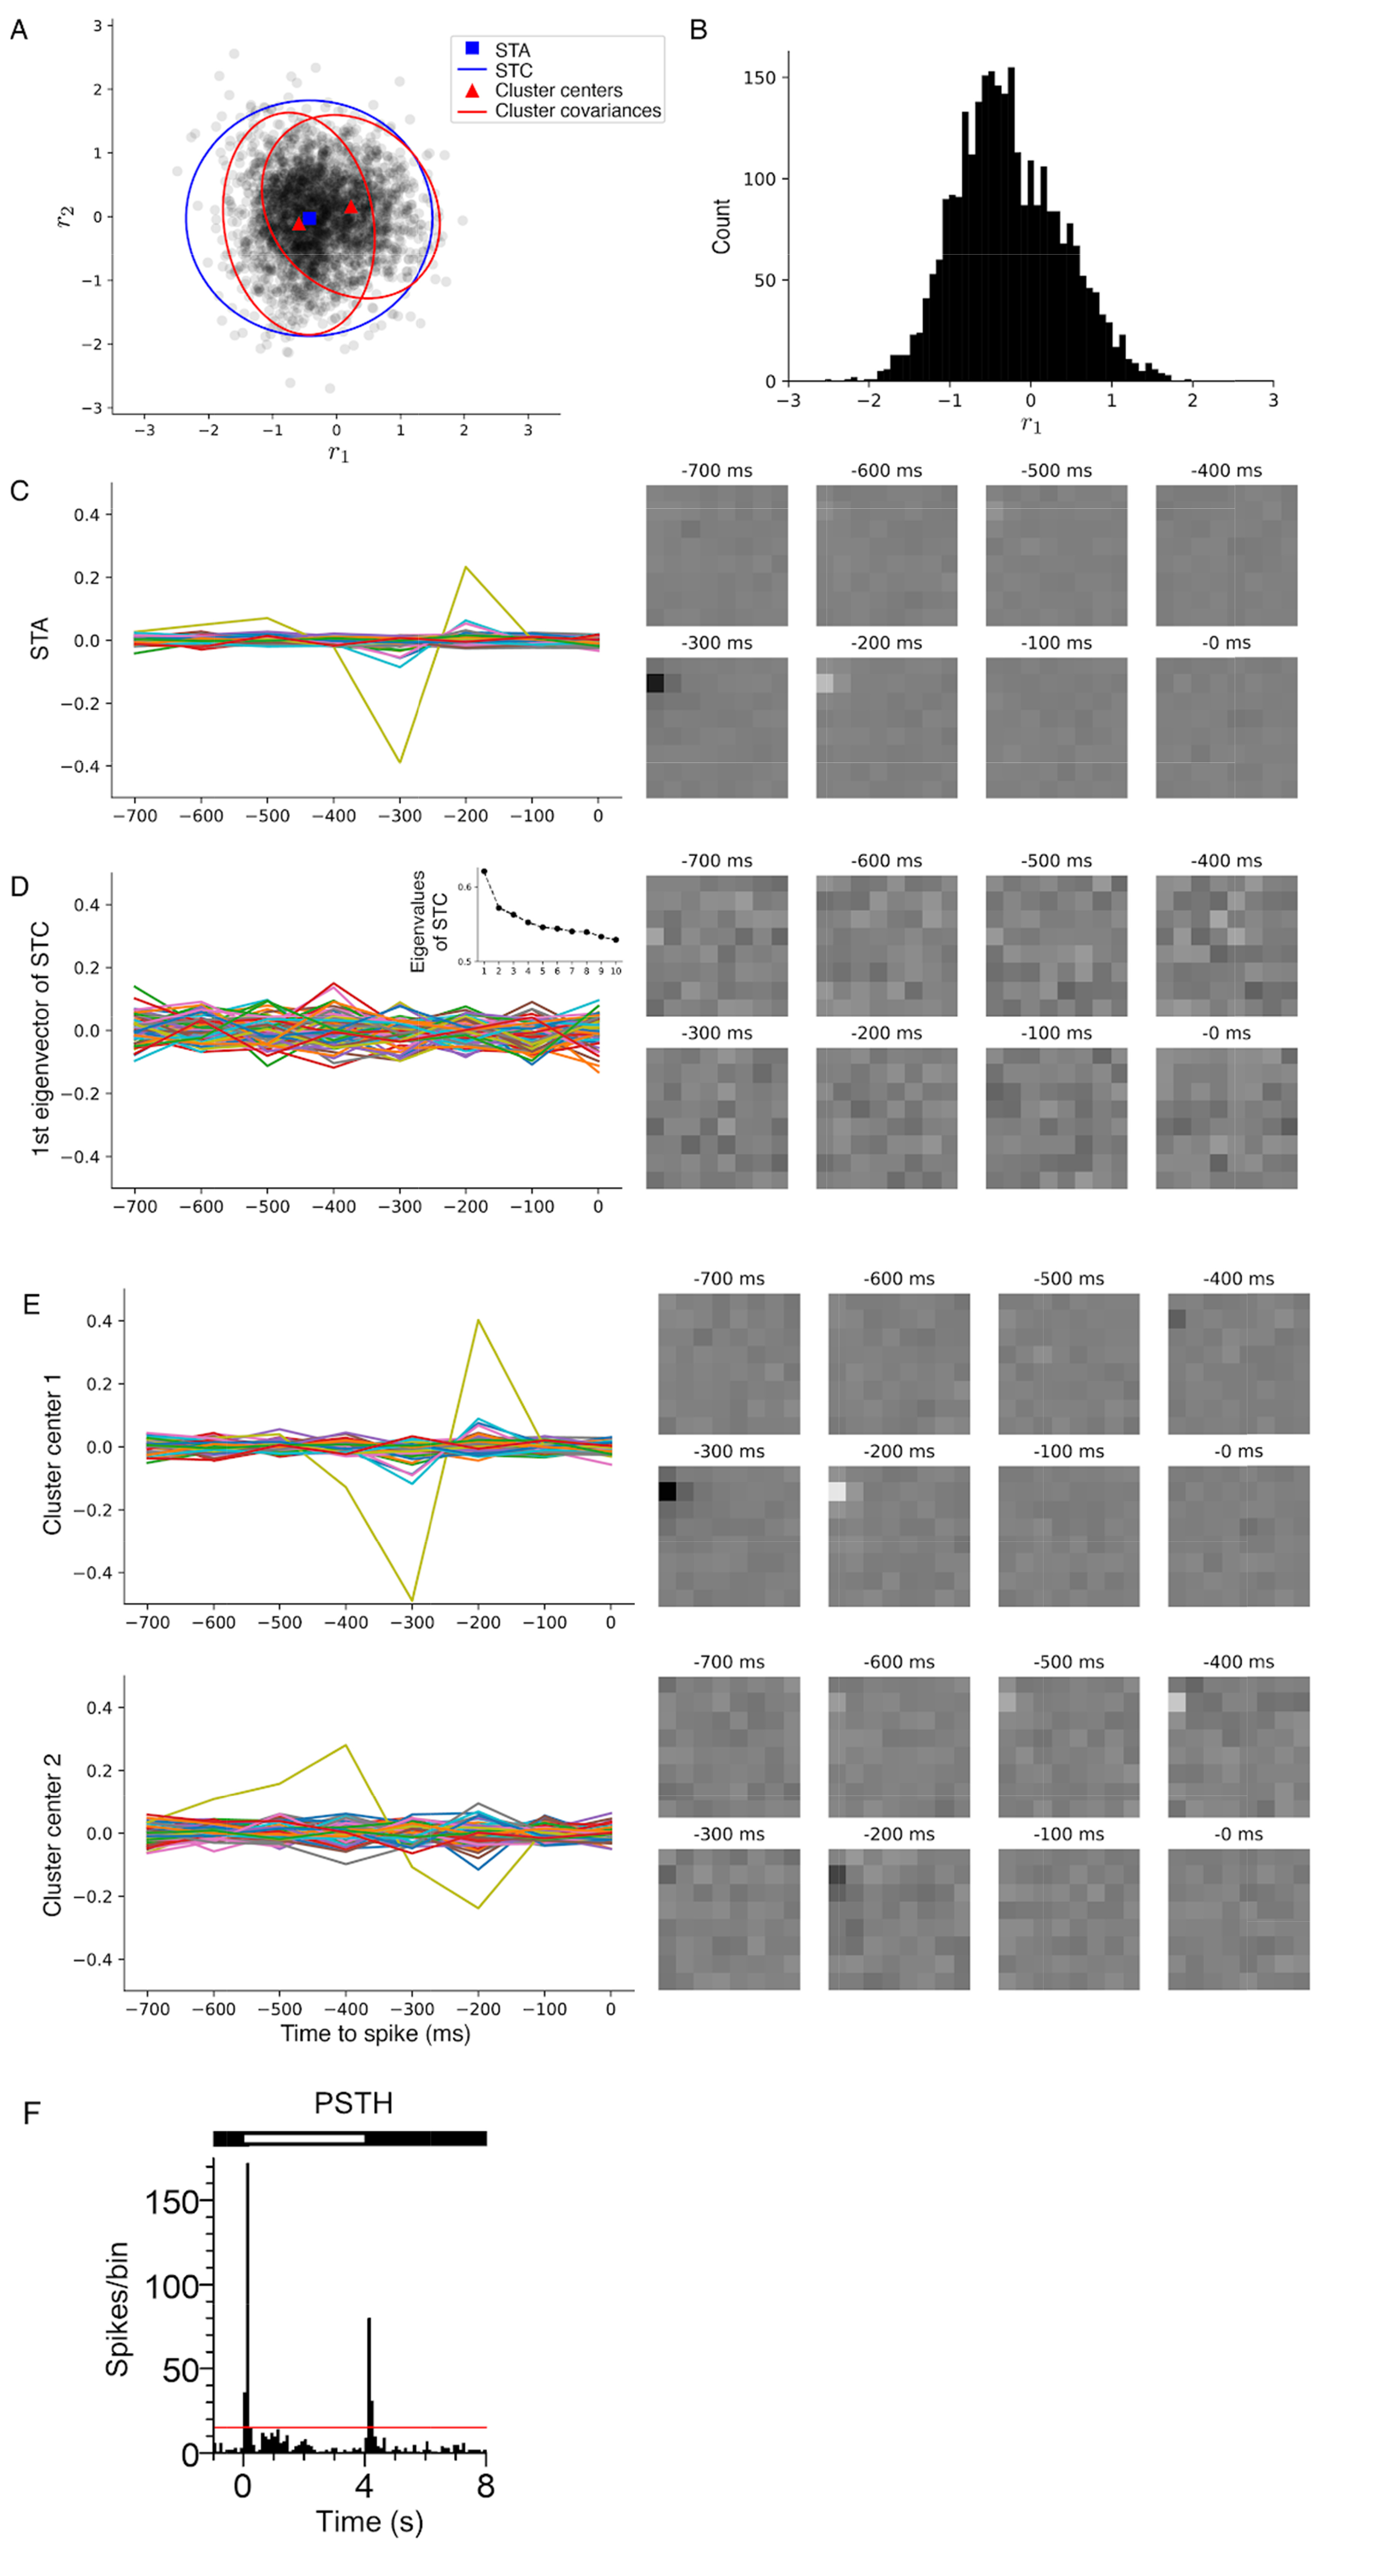
Fig. 4. STA, STC, and STCL comparison: unbalanced ON-OFF RGC. (A) Scatter plot of dimension-reduced spike-triggered stimuli, which appears to be a mixture of two blobs. The STA and STC are marked by a blue square and blue ellipse, respectively. The STCL analysis clusters the same data into two groups, whose centers and covariances are shown as red triangles and red ellipses, respectively. (B) Shown is a histogram of projections to the first eigenvector (v1), plus a mixture of two overlapping modes with different strengths. (C) Temporal (left) and spatial (right) STA profiles showing the RGC’s ON responses. The STC’s 10 largest eigenvalues are shown in (D), left, inset, where the largest eigenvalue stands out from the others. However, the corresponding eigenvector does not show any noticeable peak in the temporal (D, left) or spatial (D, right) profiles. (E) Each row shows the temporal (left) and spatial (right) profiles of a cluster center identified by STCL. The first cluster center (top), similarly to the STA, shows a strong ON response but a greater peak-to-peak difference than the STA. The other cluster center (bottom) shows a weaker OFF response not detected by either the STA or STC analysis. (F) Shown are post-stimulus time histogram (PSTH) graphs of RGC response to full-field illumination of 4 s ON and 4 s OFF duration (time bin: 100 ms). The red horizontal line inside the PSTH graph indicates one-sided 95% confidence interval.
© Exp Neurobiol