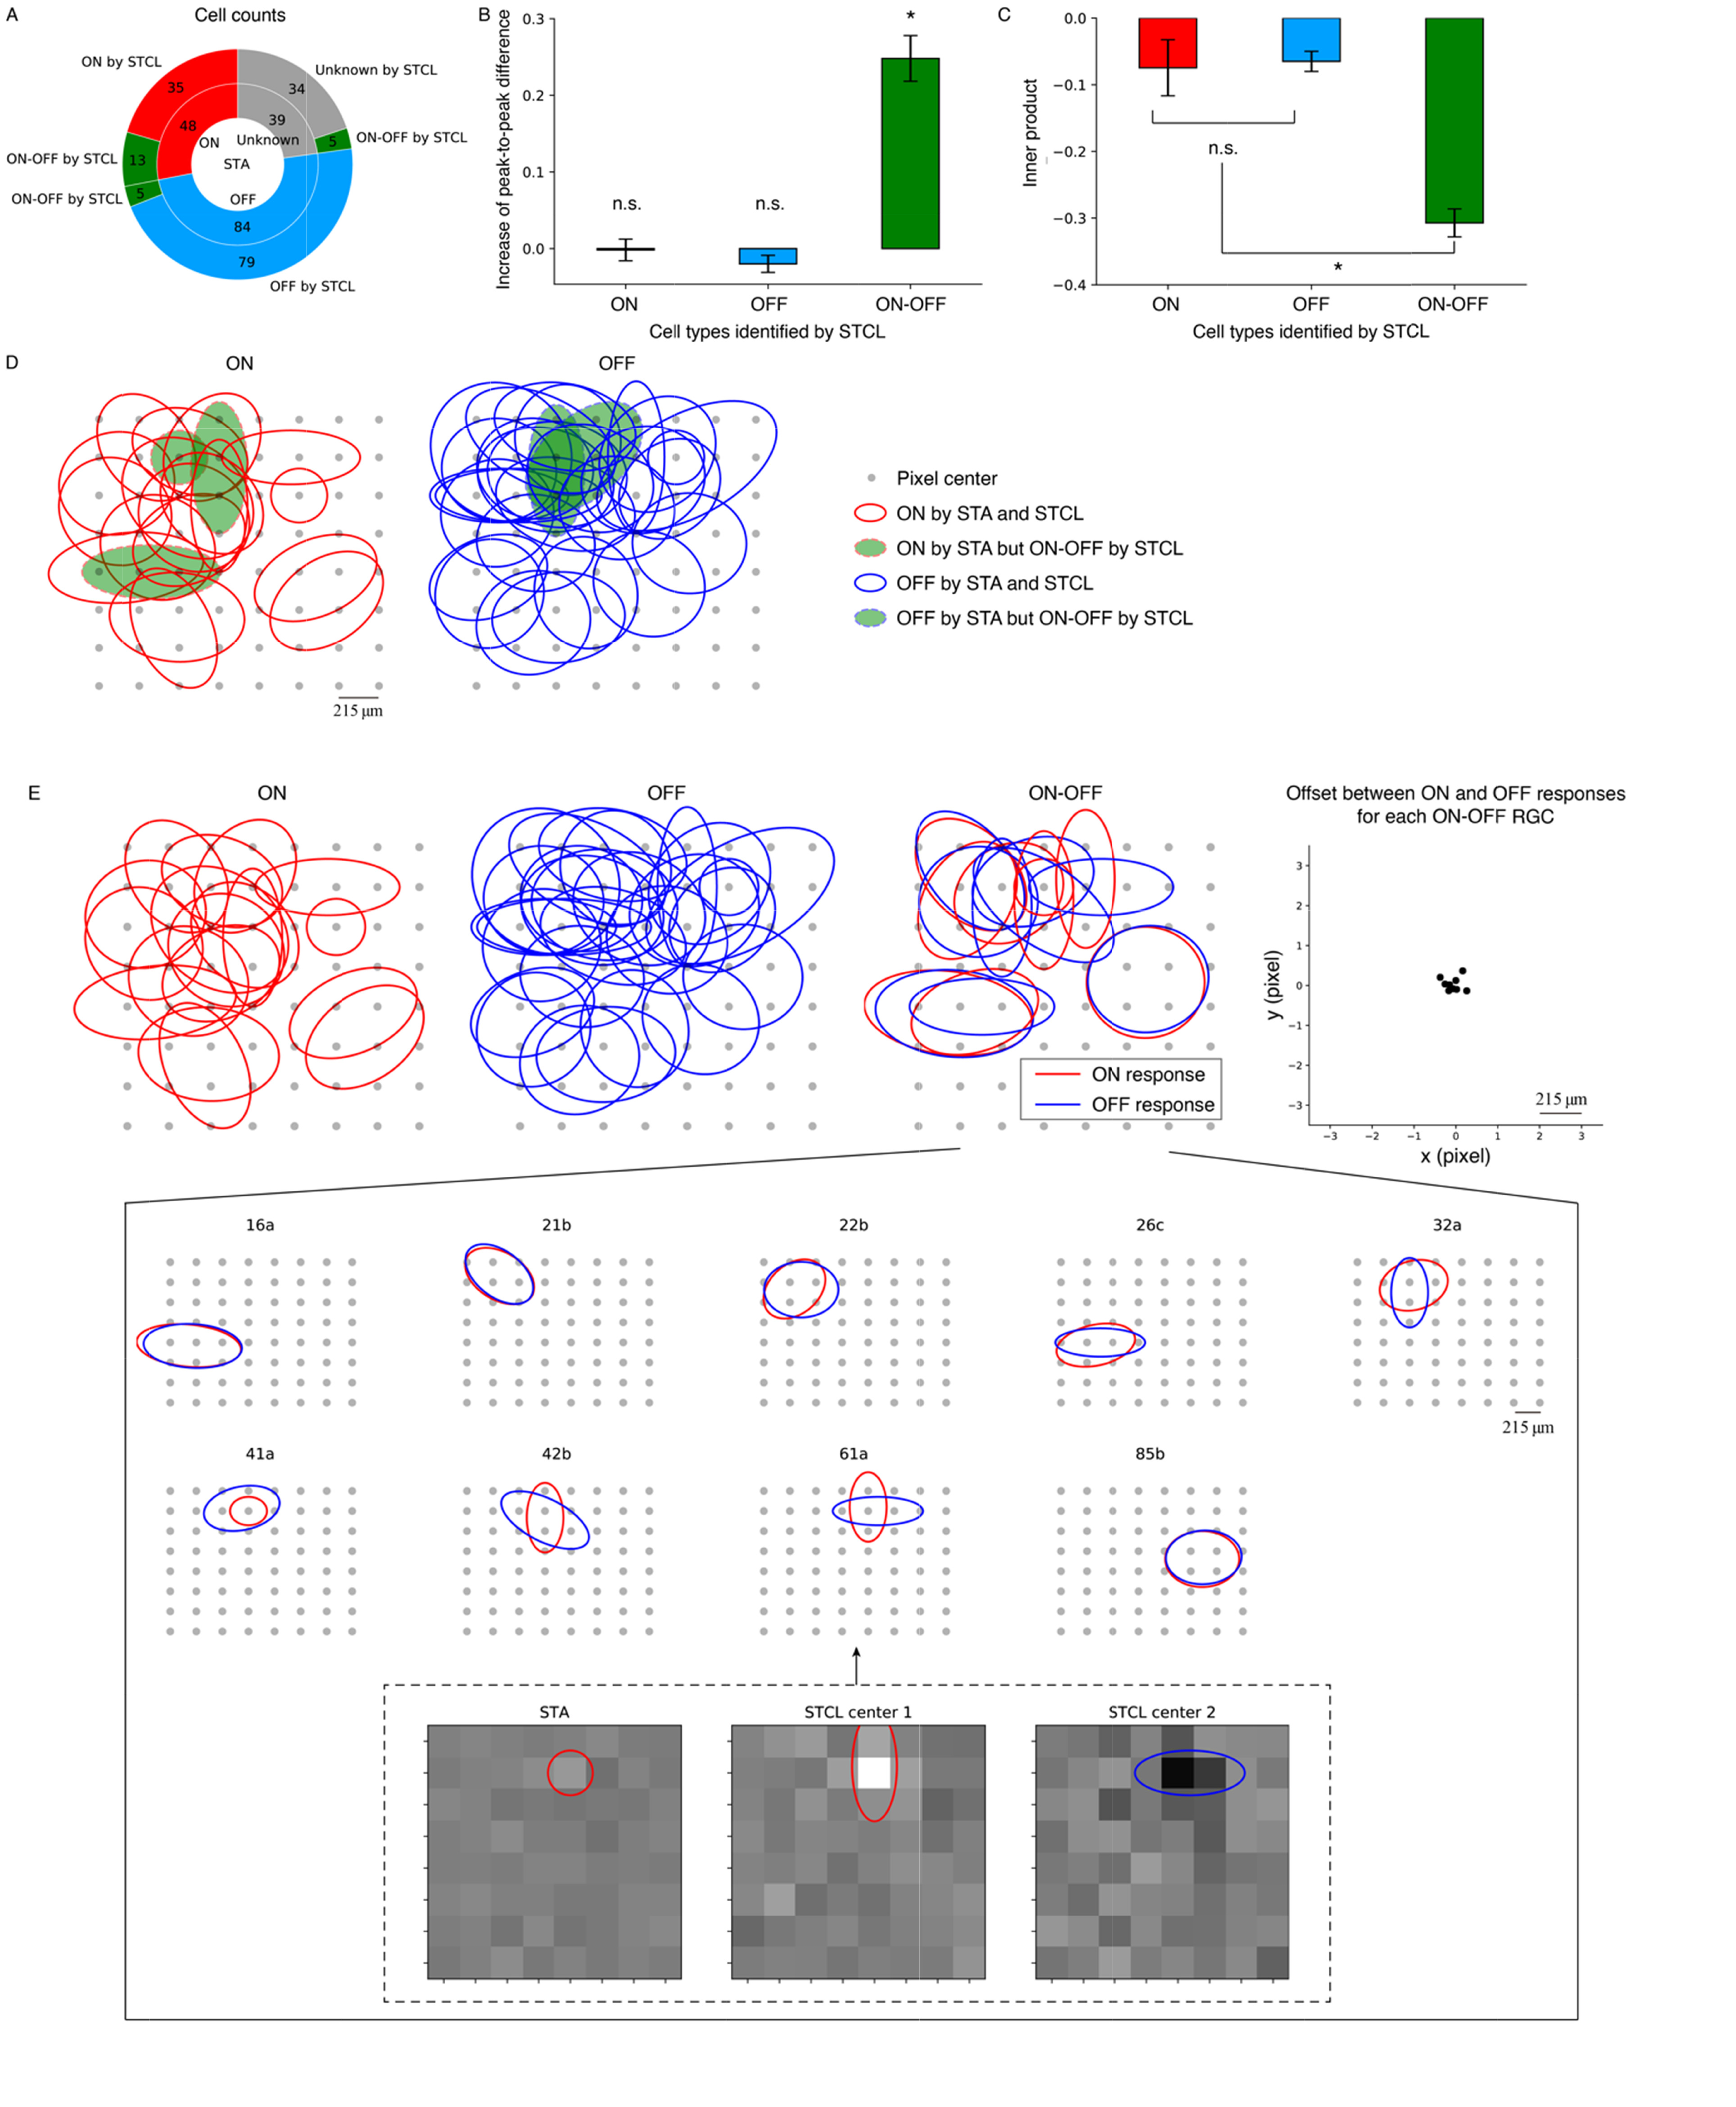
Fig. 7. Statistics and mosaics of RGC cell types. Based on STAs, the 171 RGCs with sufficient spikes for analysis are classified into 48 ON, 84 OFF, and 39 unknown types (A, inner pie chart). Among these RGCs, 13 RGCs labeled as ON by STA and five labeled as OFF by STA are reclassified as ON-OFF RGCs based on STCL, while five labeled as unknown by STA are identified as ON-OFF based on STCL (A, outer pie chart, in green). Thus, using spike-triggered clustering analysis, we identified 23 (13%) ON-OFF RGCs among the 171 RGCs. (B) Peak-to-peak differences of cluster centers are significantly greater than those of STAs for ON-OFF RGCs, but not for ON or OFF RGCs. (C) Inner products between cluster centers are significantly less for ON-OFF RGCs than for ON or OFF RGCs, while no significant difference is observed between the inner products of ON and OFF RGCs. (D) RF mosaics of ON and OFF RGCs identified by STA for a retinal patch, where solid lines represent RFs whose STA-classified cell types agree with those classified by STCL, with dashed lines indicating disagreement. (E) RF mosaics of ON (1st), OFF (2nd), and ON-OFF (3rd) RGCs identified by STCL for the same retinal patch. For cell 61a ON-OFF RGCs, the ellipsoidal fits of ON and OFF responses of the RGC appear to be oriented toward different angles. The spatial profiles of the STA (left) and STCL centers (middle and right) of the cell 61a are shown in inset figure. STA analysis shows that this RGC appeared to be an ON RGC with a weak light modulation and RF size was about one pixel. However, the STCL analysis showed that this RGC was actually ON-OFF RGC with stronger ON and slightly weaker OFF responses. (F) Offset of centers in the RF ellipses between ON and OFF responses calculated for each ON-OFF RGC (4th).
© Exp Neurobiol