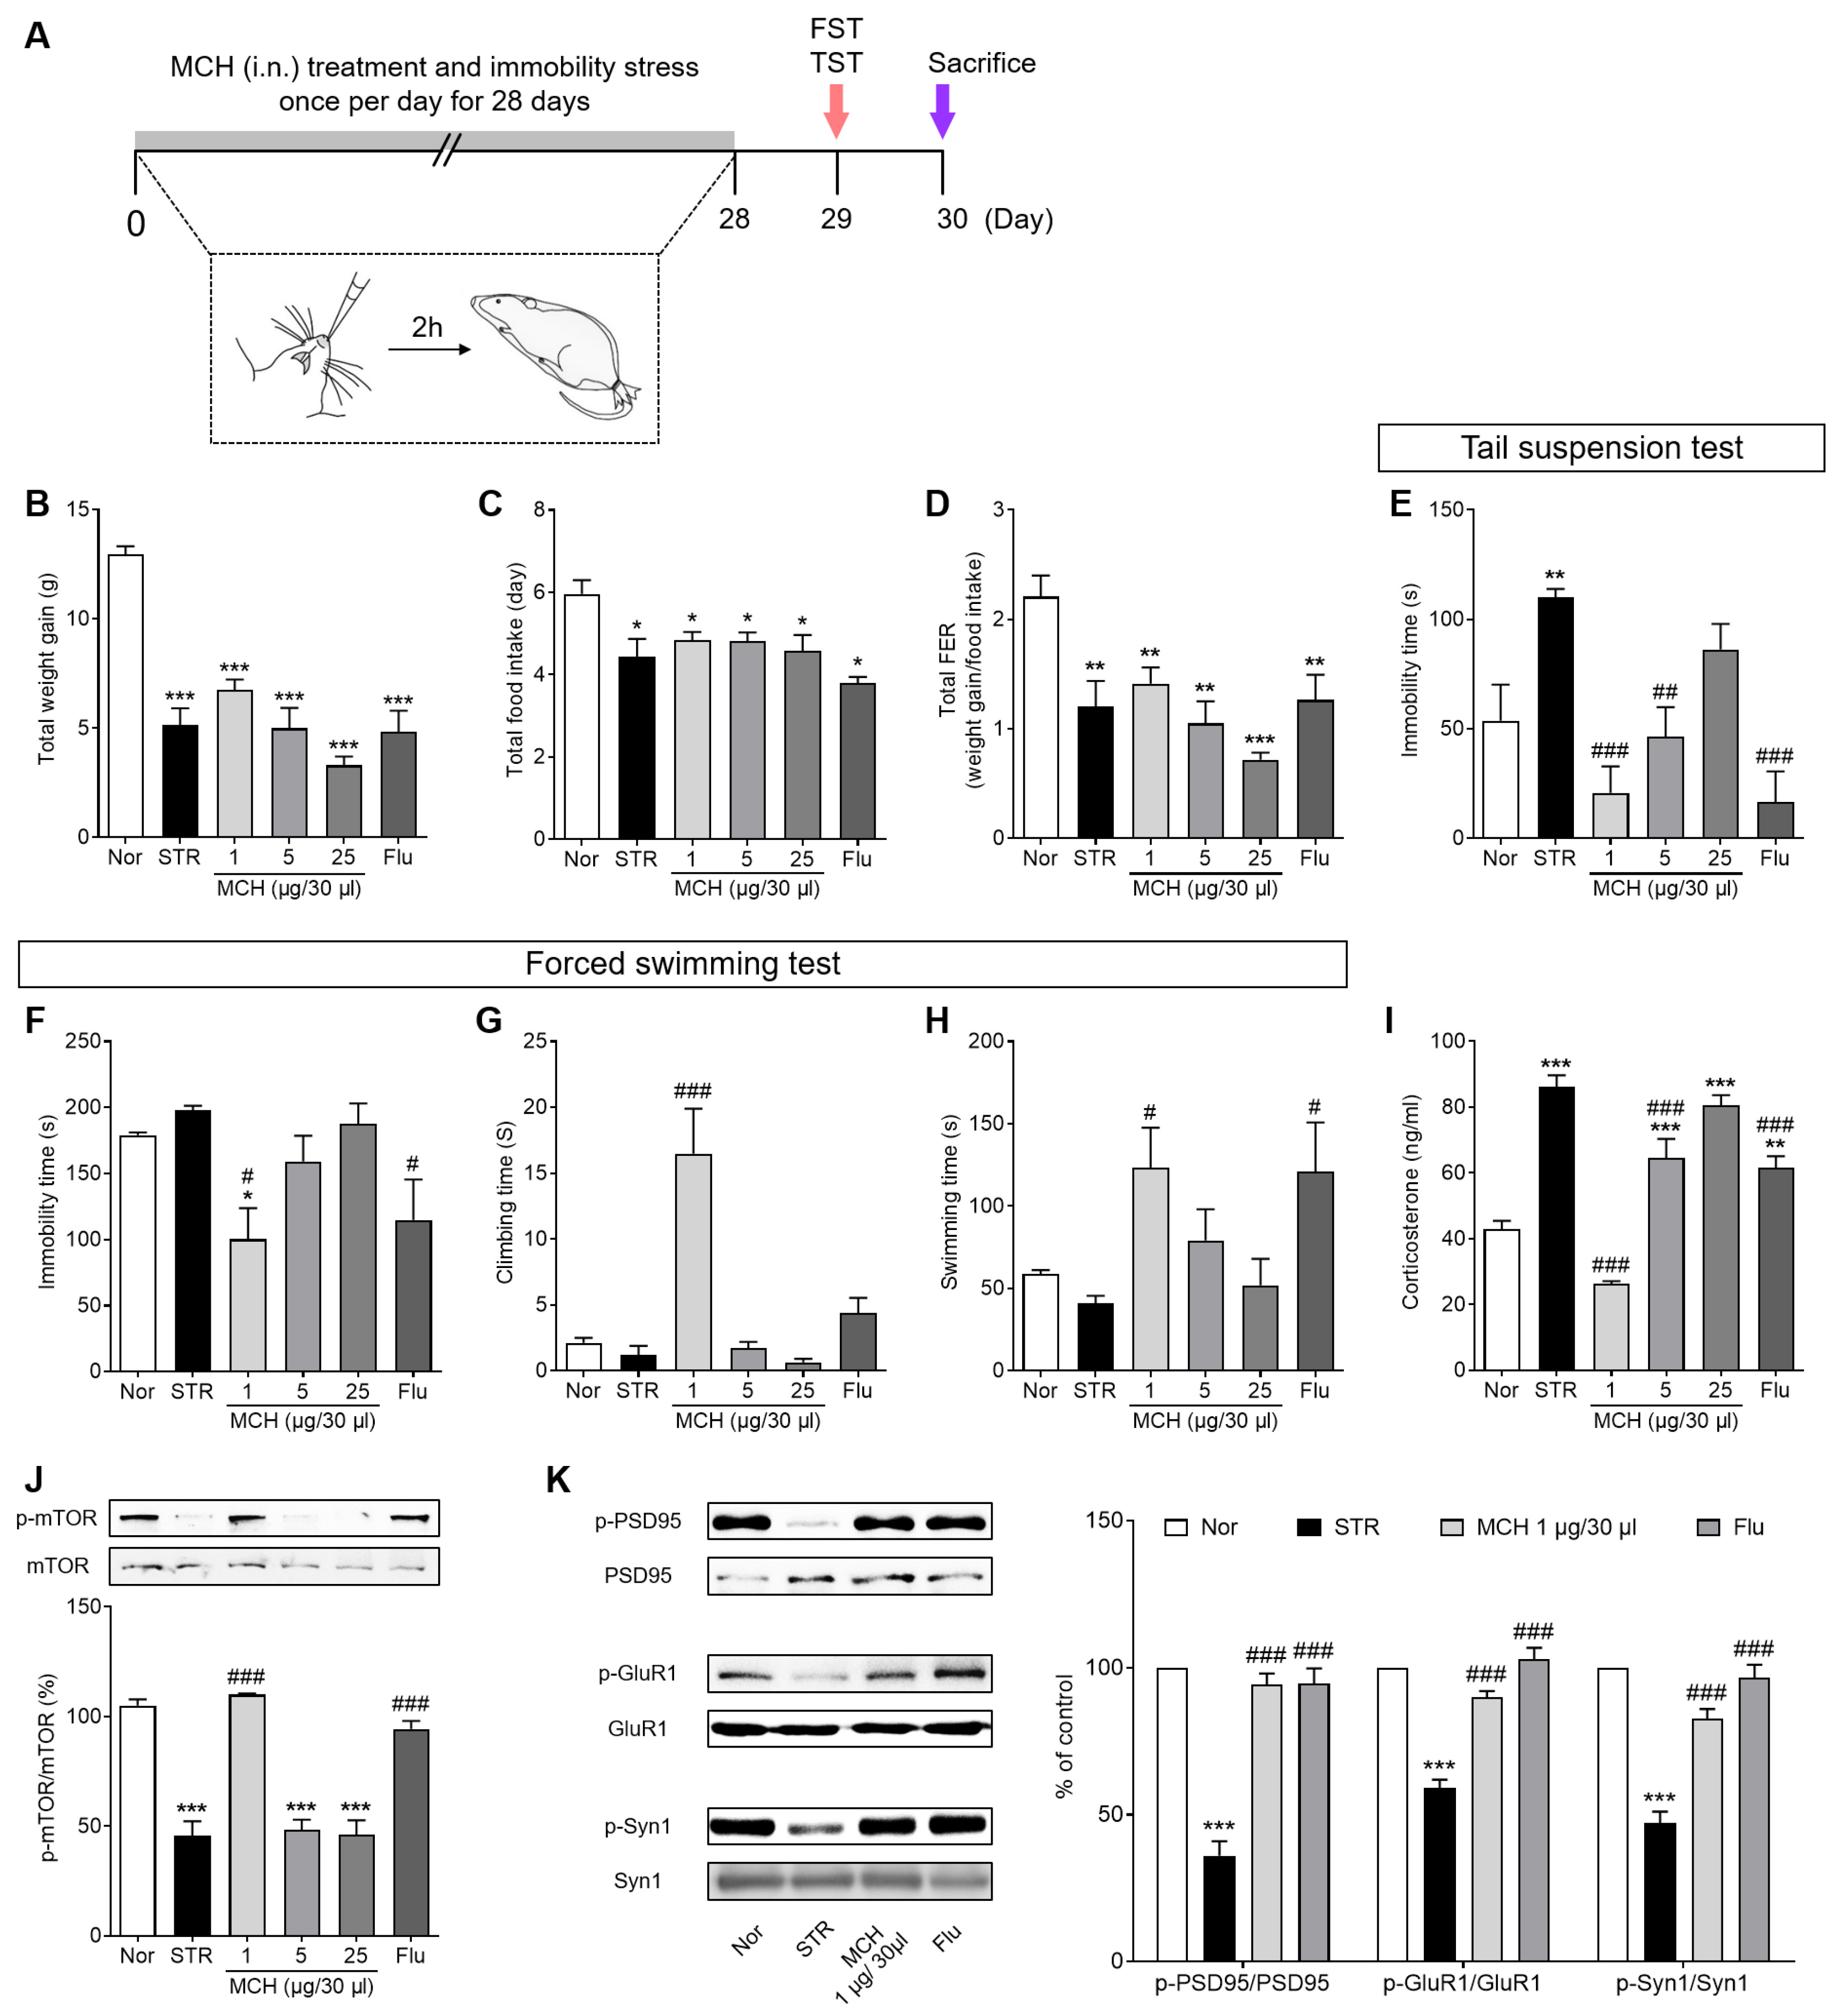
Fig. 4. Antidepressant-like effects of MCH in stressed mice. (A) Schematic representation of the STR paradigm. (B) Total weight gain was divided by (C) total food intake to calculate (D) total FER. (E) TST was administered during the 6-min test period and immobility time was recorded. (F) Immobility, (G) climbing, and (H) swimming behaviors in mice were observed during the last 4 min test period and climbing or swimming time was recorded. (I) Concentration of corticosterone was measured using an ELISA kit. The phosphorylation levels of (J) mTOR, (K) PSD95, GluR1 and Syn1 in the PFC were measured by immunoblotting. The amount of phosphorylated proteins were normalized to that of total proteins and presented as bar graphs (right panel). Data represent the means±SEM. ***p<0.001, **p<0.01, *p<0.05 vs. Nor group, ###p<0.001, ##p<0.01, #p<0.05 vs. STR group. Nor, normal; STR, stress; Flu, fluoxetine; FST, forced swim test; TST, tail suspension test.
© Exp Neurobiol