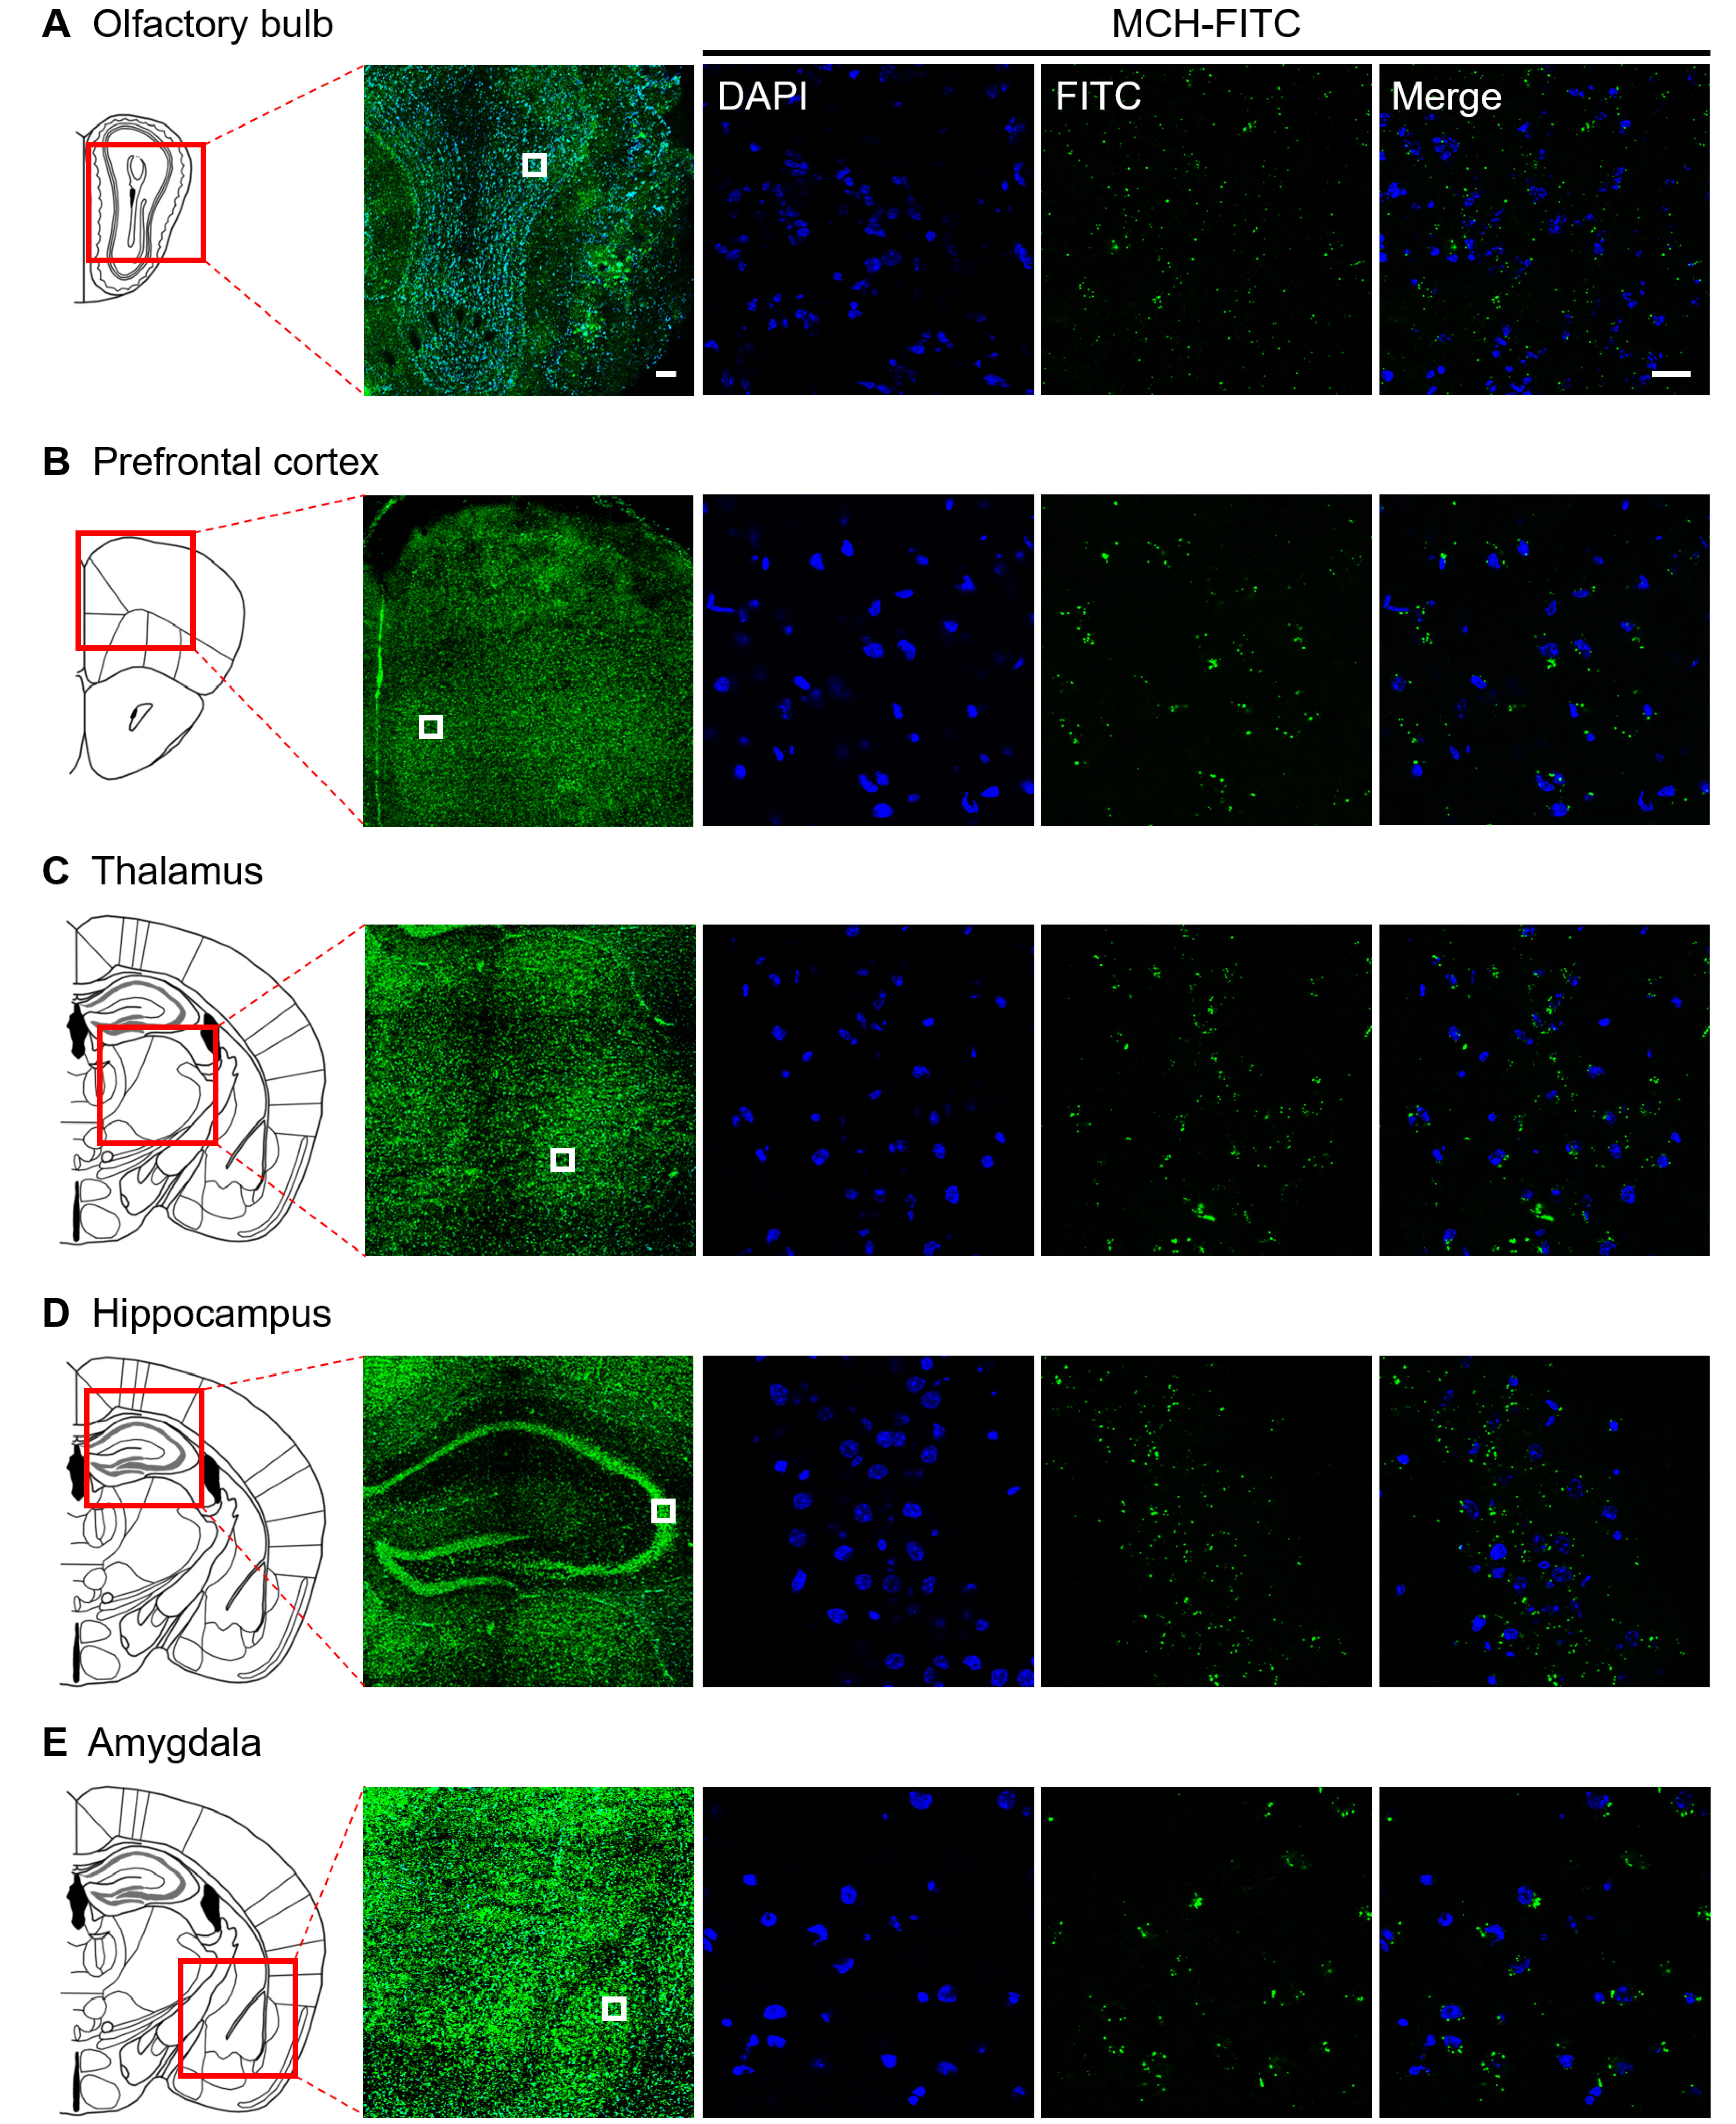
Fig. 7. Distribution of MCH in the brain after intranasal administration. Representative figure showing the distribution of MCH after 30 min of intranasal administration of MCH-FITC (10 μg/30 μl) in the (A) olfactory bulb, (B) PFC, (C) thalamus, (D) hippocampus, and (E) amygdala of mouse brain. Scale bar: 400 and 30 μm.
© Exp Neurobiol