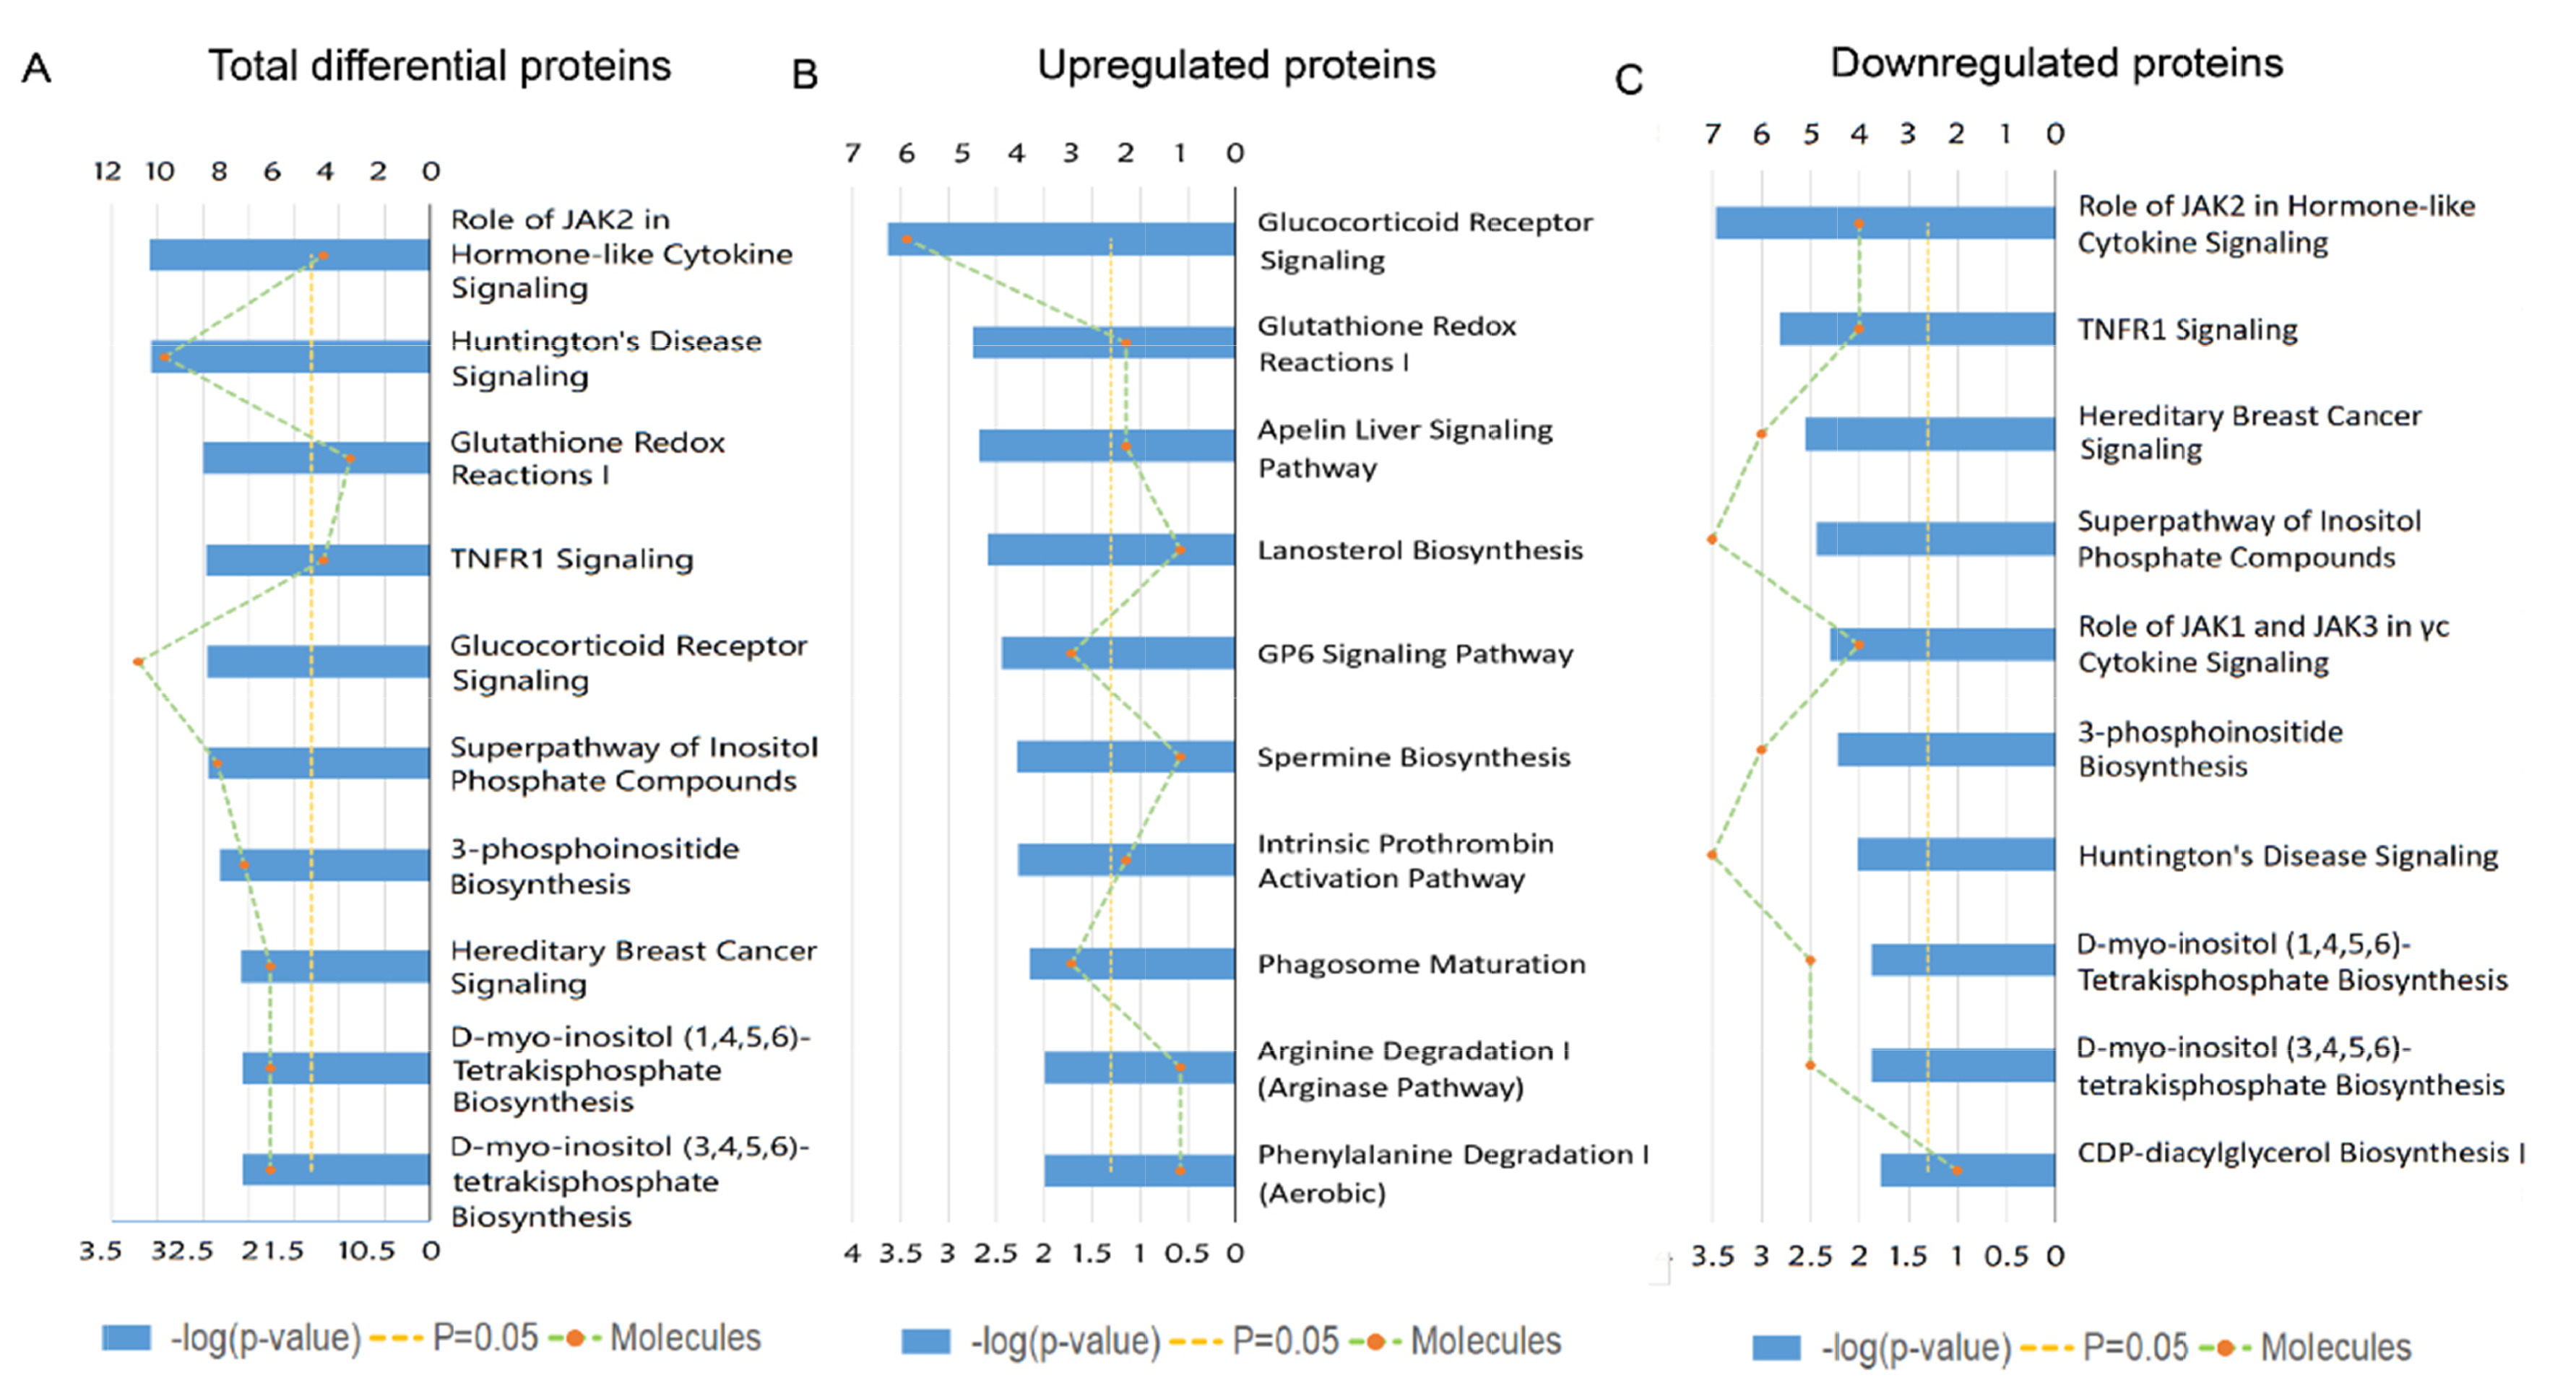
Fig. 3. Ingenuity Pathway Analysis (IPA) analysis of the differentially expressed proteins in the GF vs. SPF comparison group. (A) IPA analysis of the 303 differentially expressed proteins in the GF vs. SPF comparison group. (B) IPA analysis of the 61 upregulated proteins in the GF vs. SPF comparison group. (C) IPA analysis of the 242 downregulated proteins in the GF vs. SPF comparison group.
© Exp Neurobiol