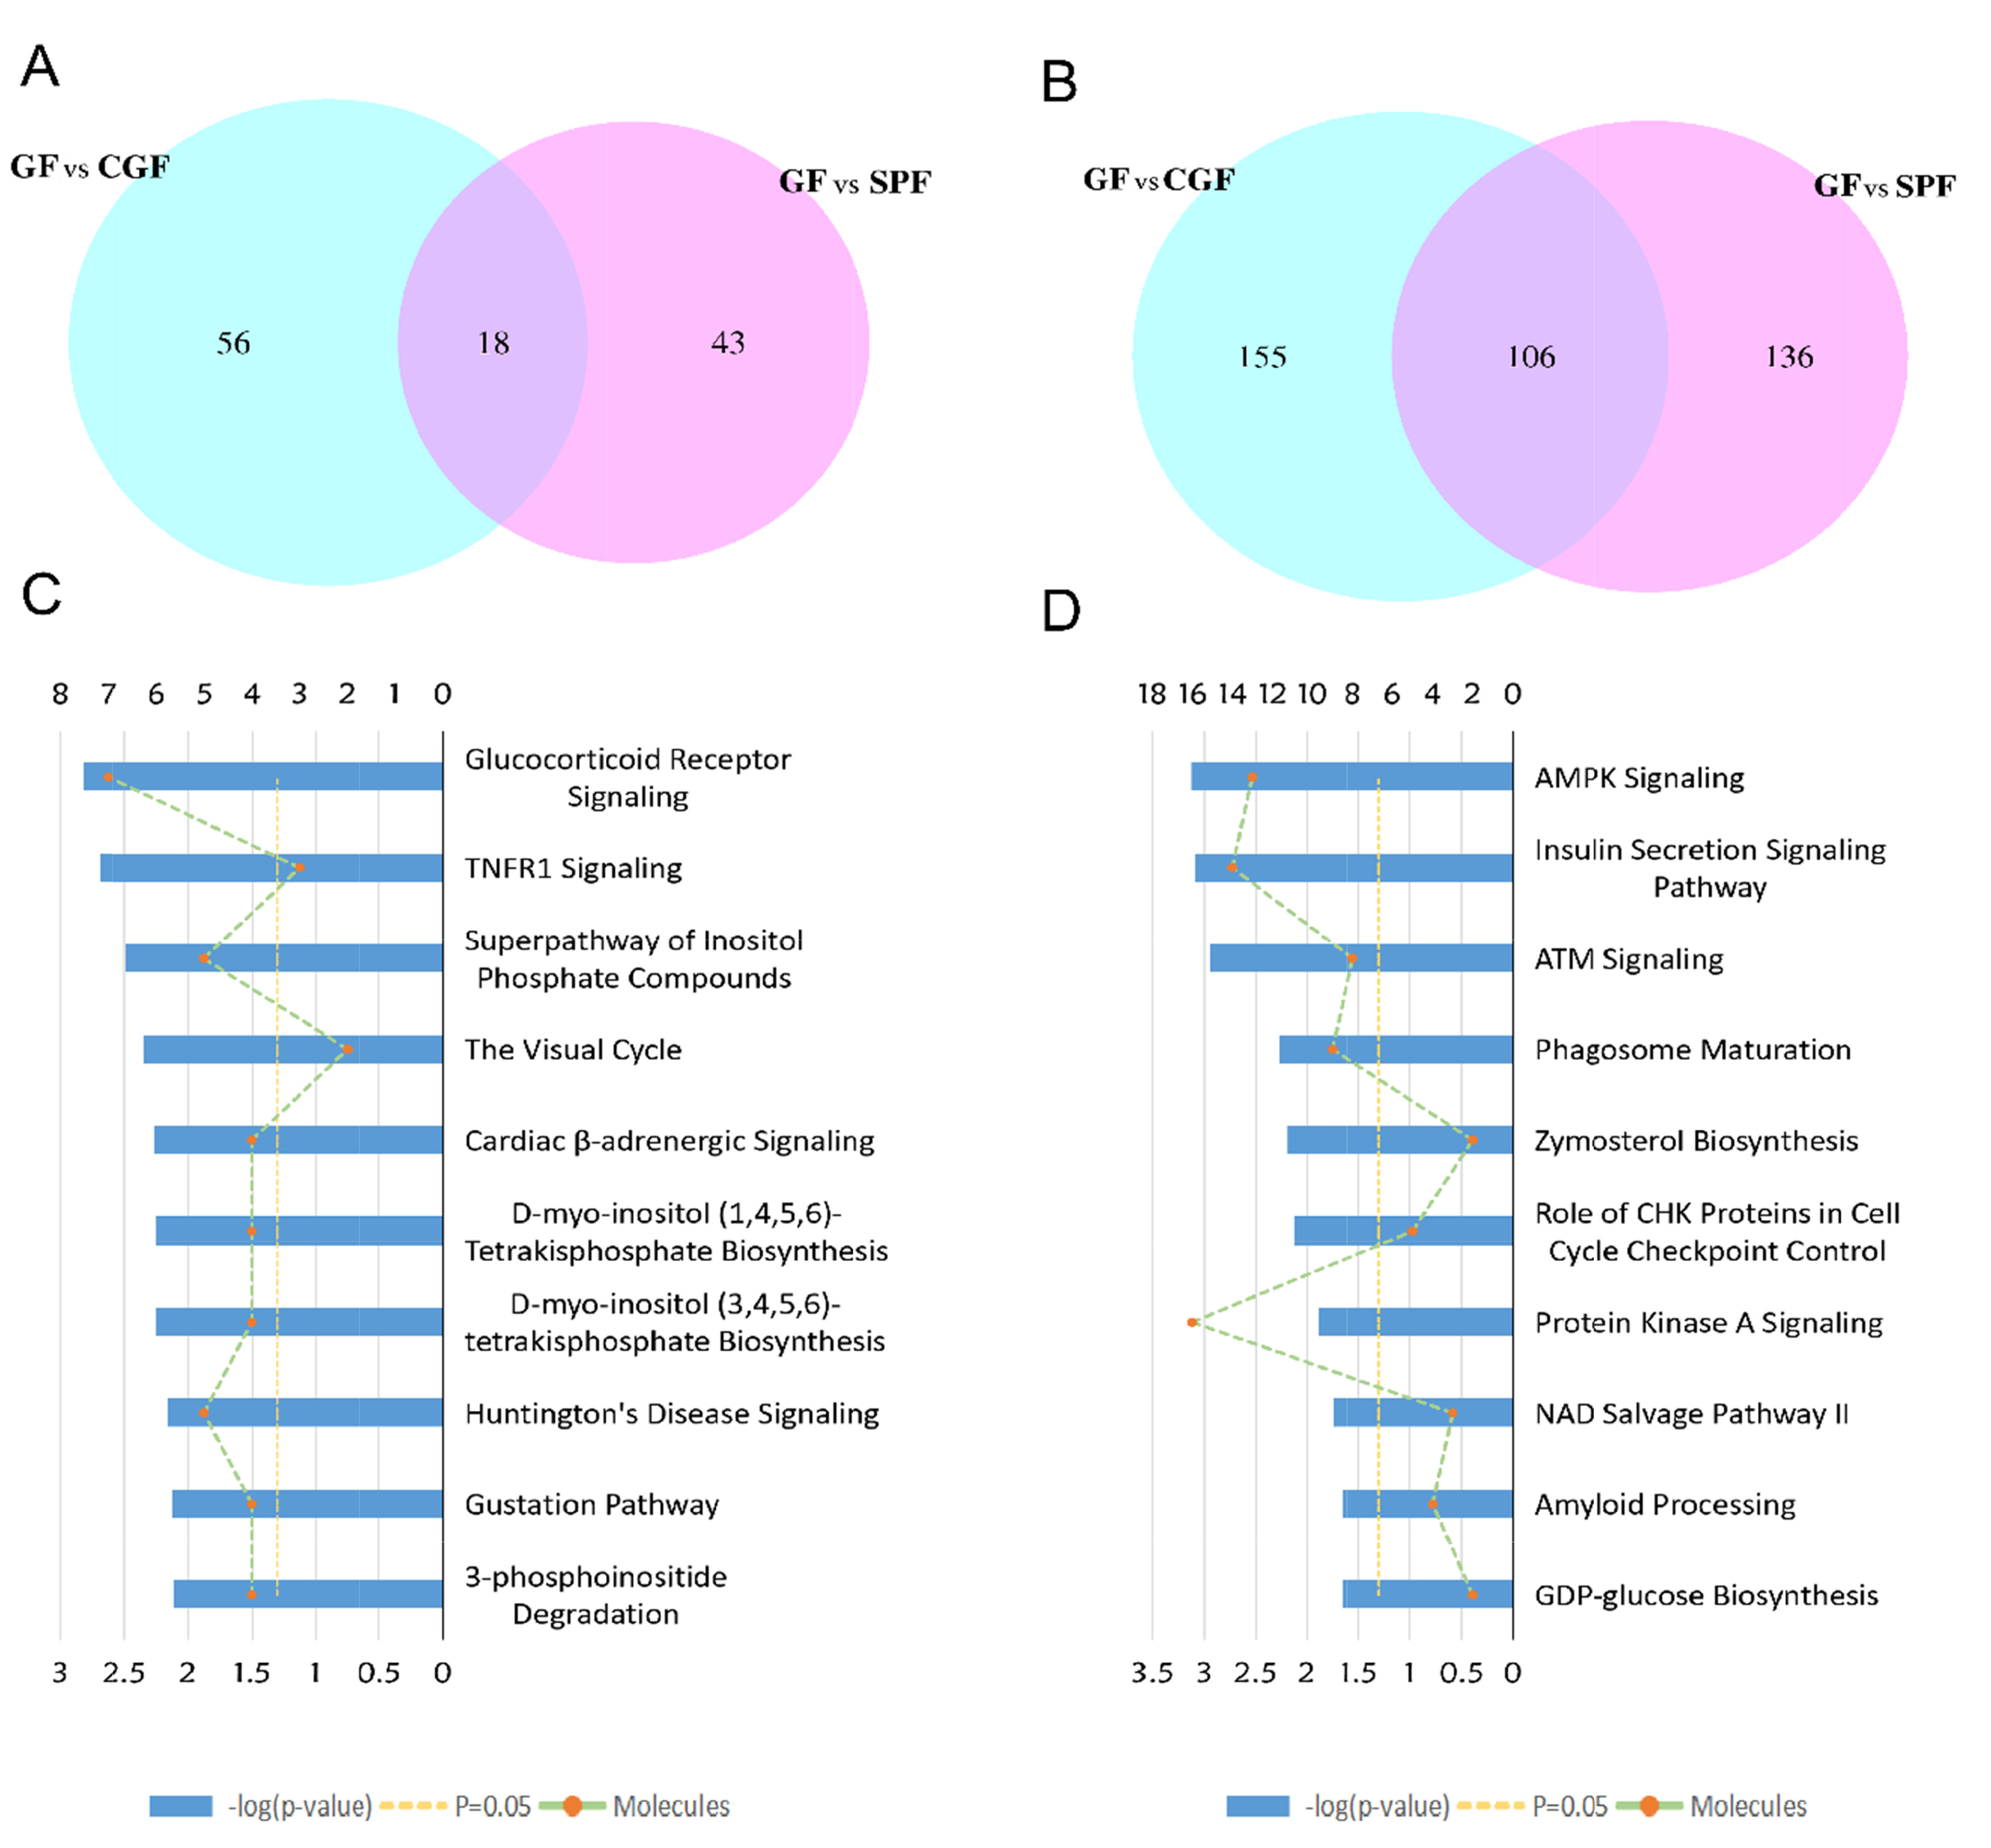
Fig. 6. Overlapping analysis for differentially expressed proteins in GF mice compared with SPF mice and Bioinformatic analysis of the 124 restored proteins. (A) Overlapping Venn diagram of the upregulated proteins in the GF vs. SPF and GF vs. CGF comparison groups. (B) Overlapping Venn diagram of the downregulated proteins in the GF vs. SPF and GF vs. CGF comparison groups. (C) Ingenuity Pathway Analysis (IPA)analysis of the 124 restored proteins. (D) Ingenuity Pathway Analysis (IPA)analysis of the 335 proteins for GF vs. CGF comparison.
© Exp Neurobiol