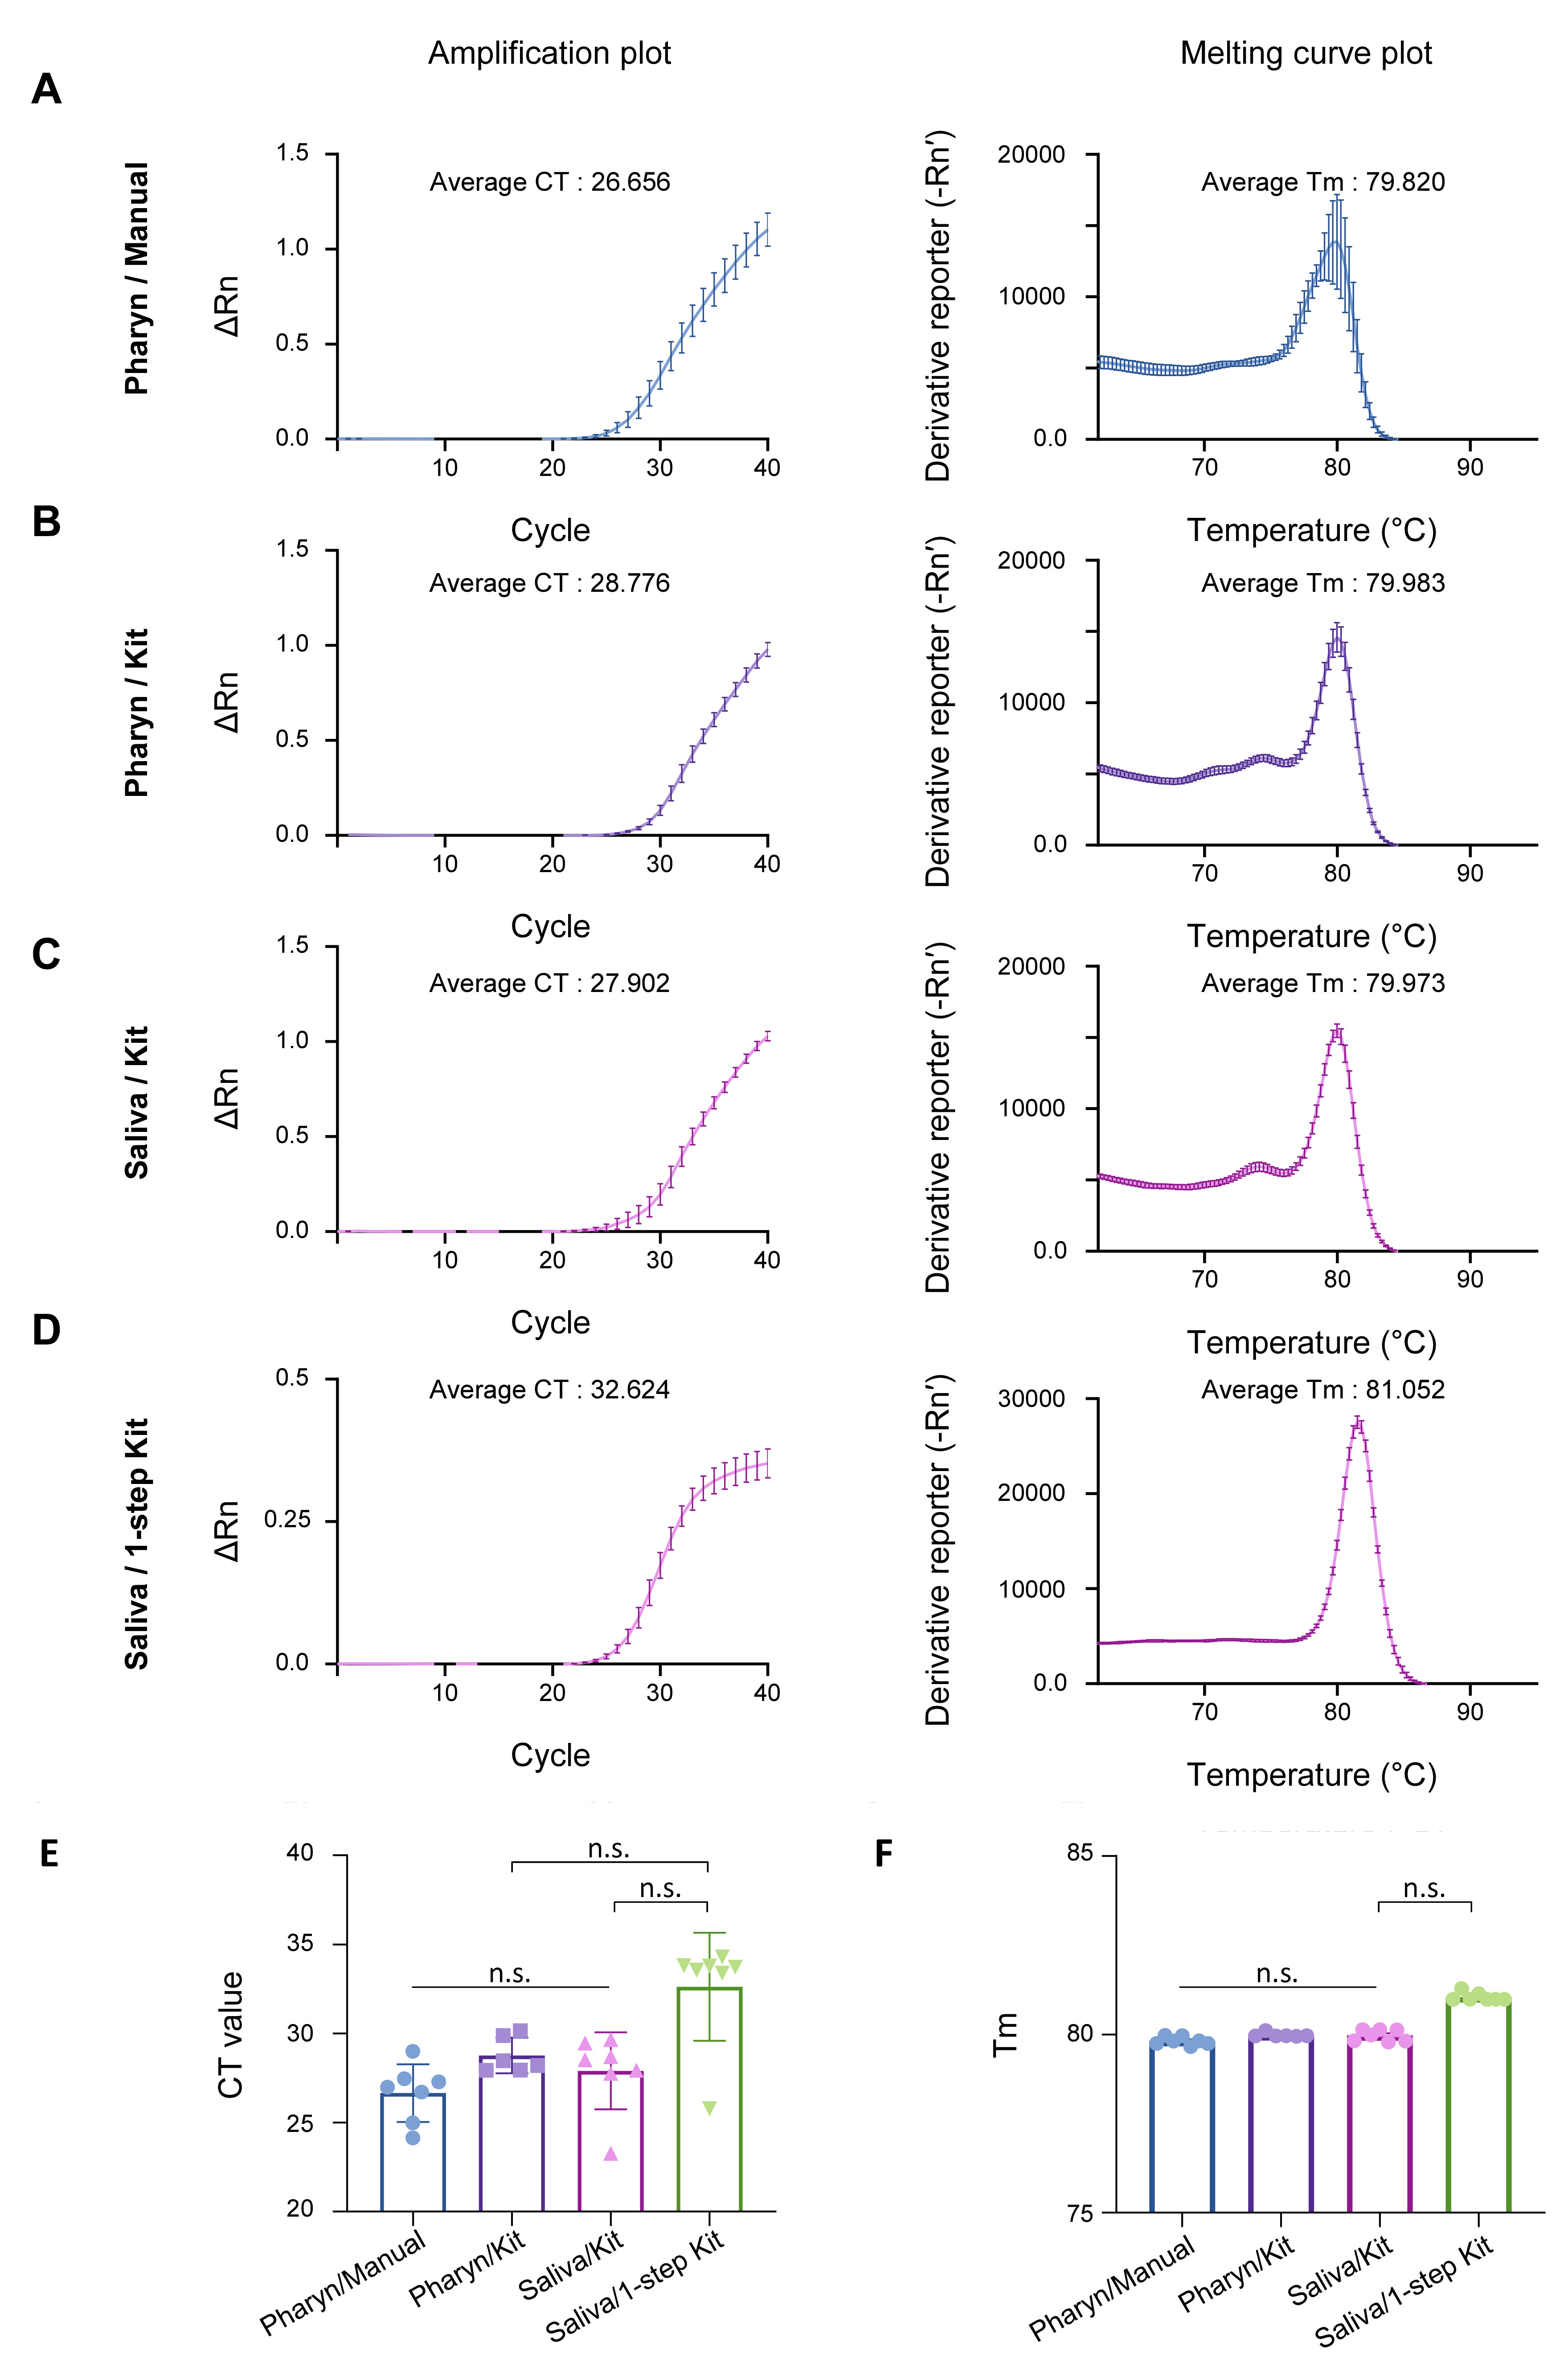
Fig. 2. Comparison of sampling quality between Pharyn/Manual, Pharyn/Kit, Saliva/Kit, and Saliva/1-step Kit by GAPDH qRT-PCR result. qRT-PCR result of amplification plot and melting curve plot from GAPDH primer set, from volunteer A-G, in (A) Pharyn/Manual, (B) Pharyn/Kit, (C) Saliva/Kit and (D) Saliva/1-step Kit prep sample. Average CT value and average Tm value are described in each figures. Reporter value (Rn) is calculated by normalized the fluorescence signal from SYBR green to reference dye, ROX. Peaks in the melting curve plot represent the melting temperature [
20] of amplicons. Derivative reporter (−Rn’) was calculated as the negative first derivative of Rn generated by the reporter during PCR amplification. All data are represented as the mean±S.E.M.