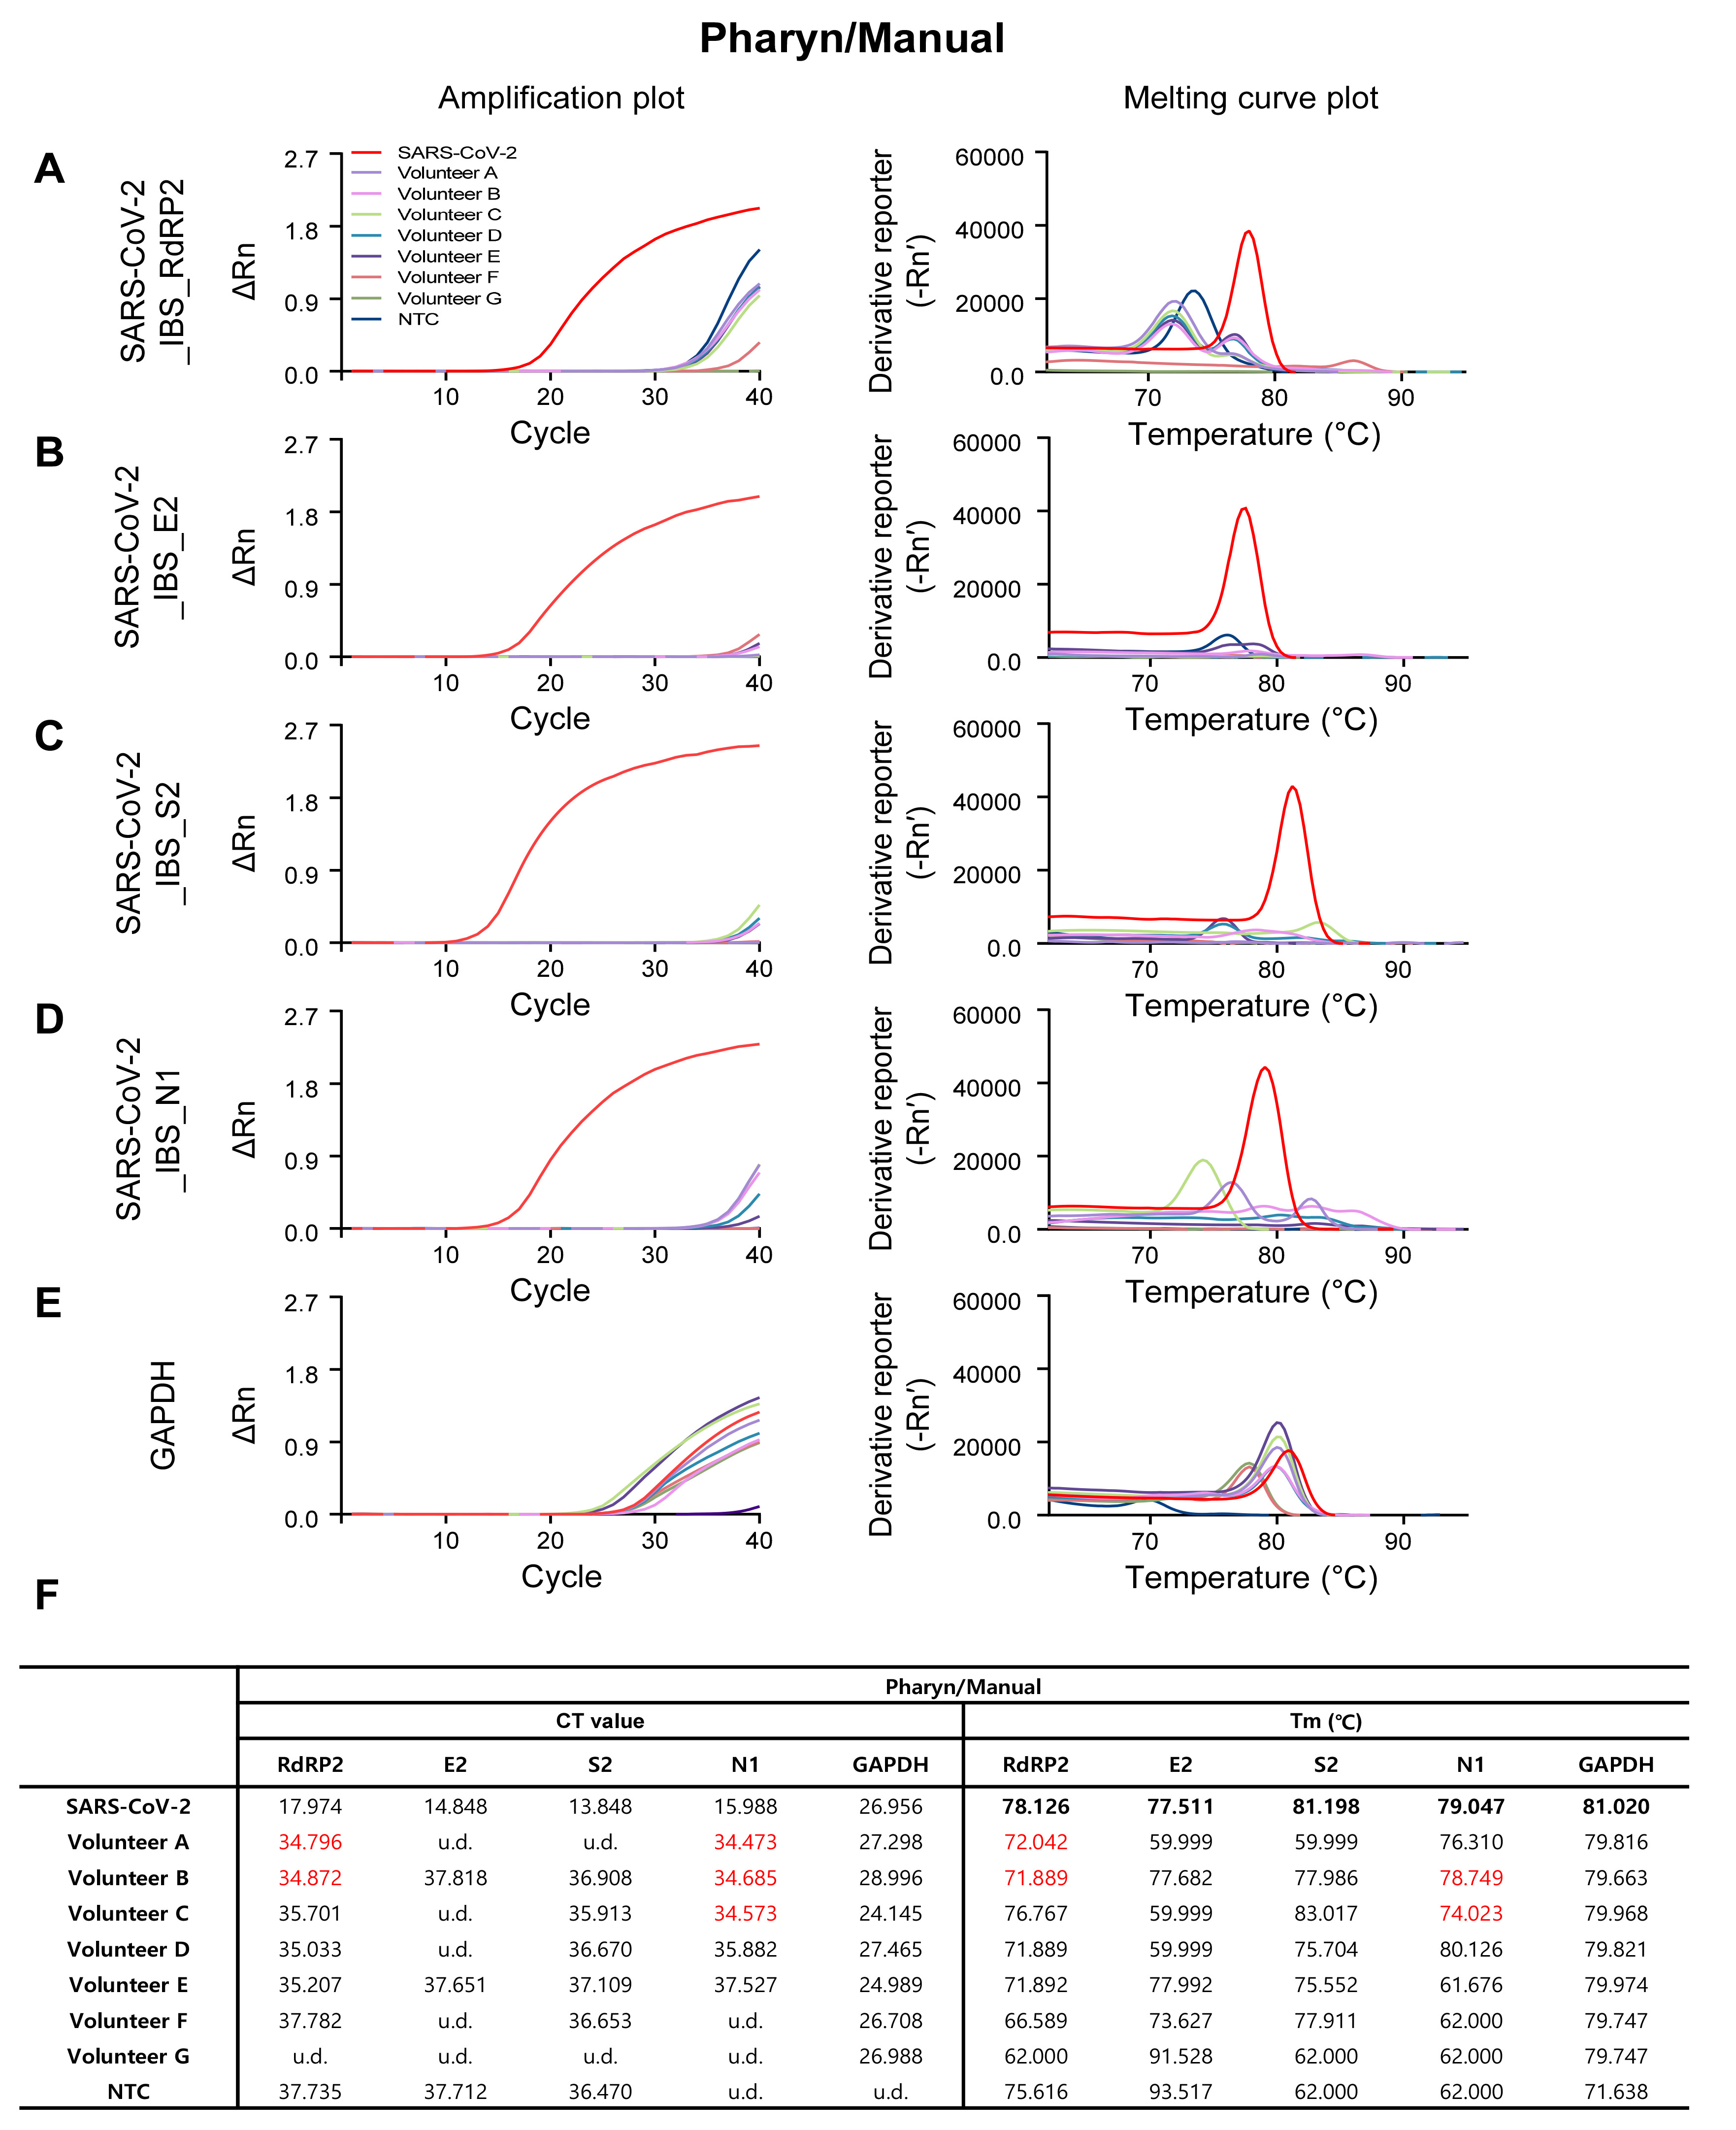
Fig. 3. Amplification and melting curve plot from Volunteer A~G’s Pharyn/Manual samples. Amplification plot (left panel) and melting curve plot (right panel) from qRT-PCR of volunteer A~G’s pharyn/manual samples. qRT-PCR was performed by using the previously reported SARS-CoV-2 primer sets; (A) SARS-CoV-2_IBS_RdRP2, (B) SARS-CoV-2_IBS_E2, (C) SARS-CoV-2_IBS_S2, (D) SARS-CoV-2_IBS_N1. (E) GAPDH primer set was used for IPC detection. Each color code represent individual volunteer result and SARS-CoV-2 amplification was represent as red color. (F) Ct value and Tm from volunteers A~G’s Pharyn/Manual samples.
© Exp Neurobiol