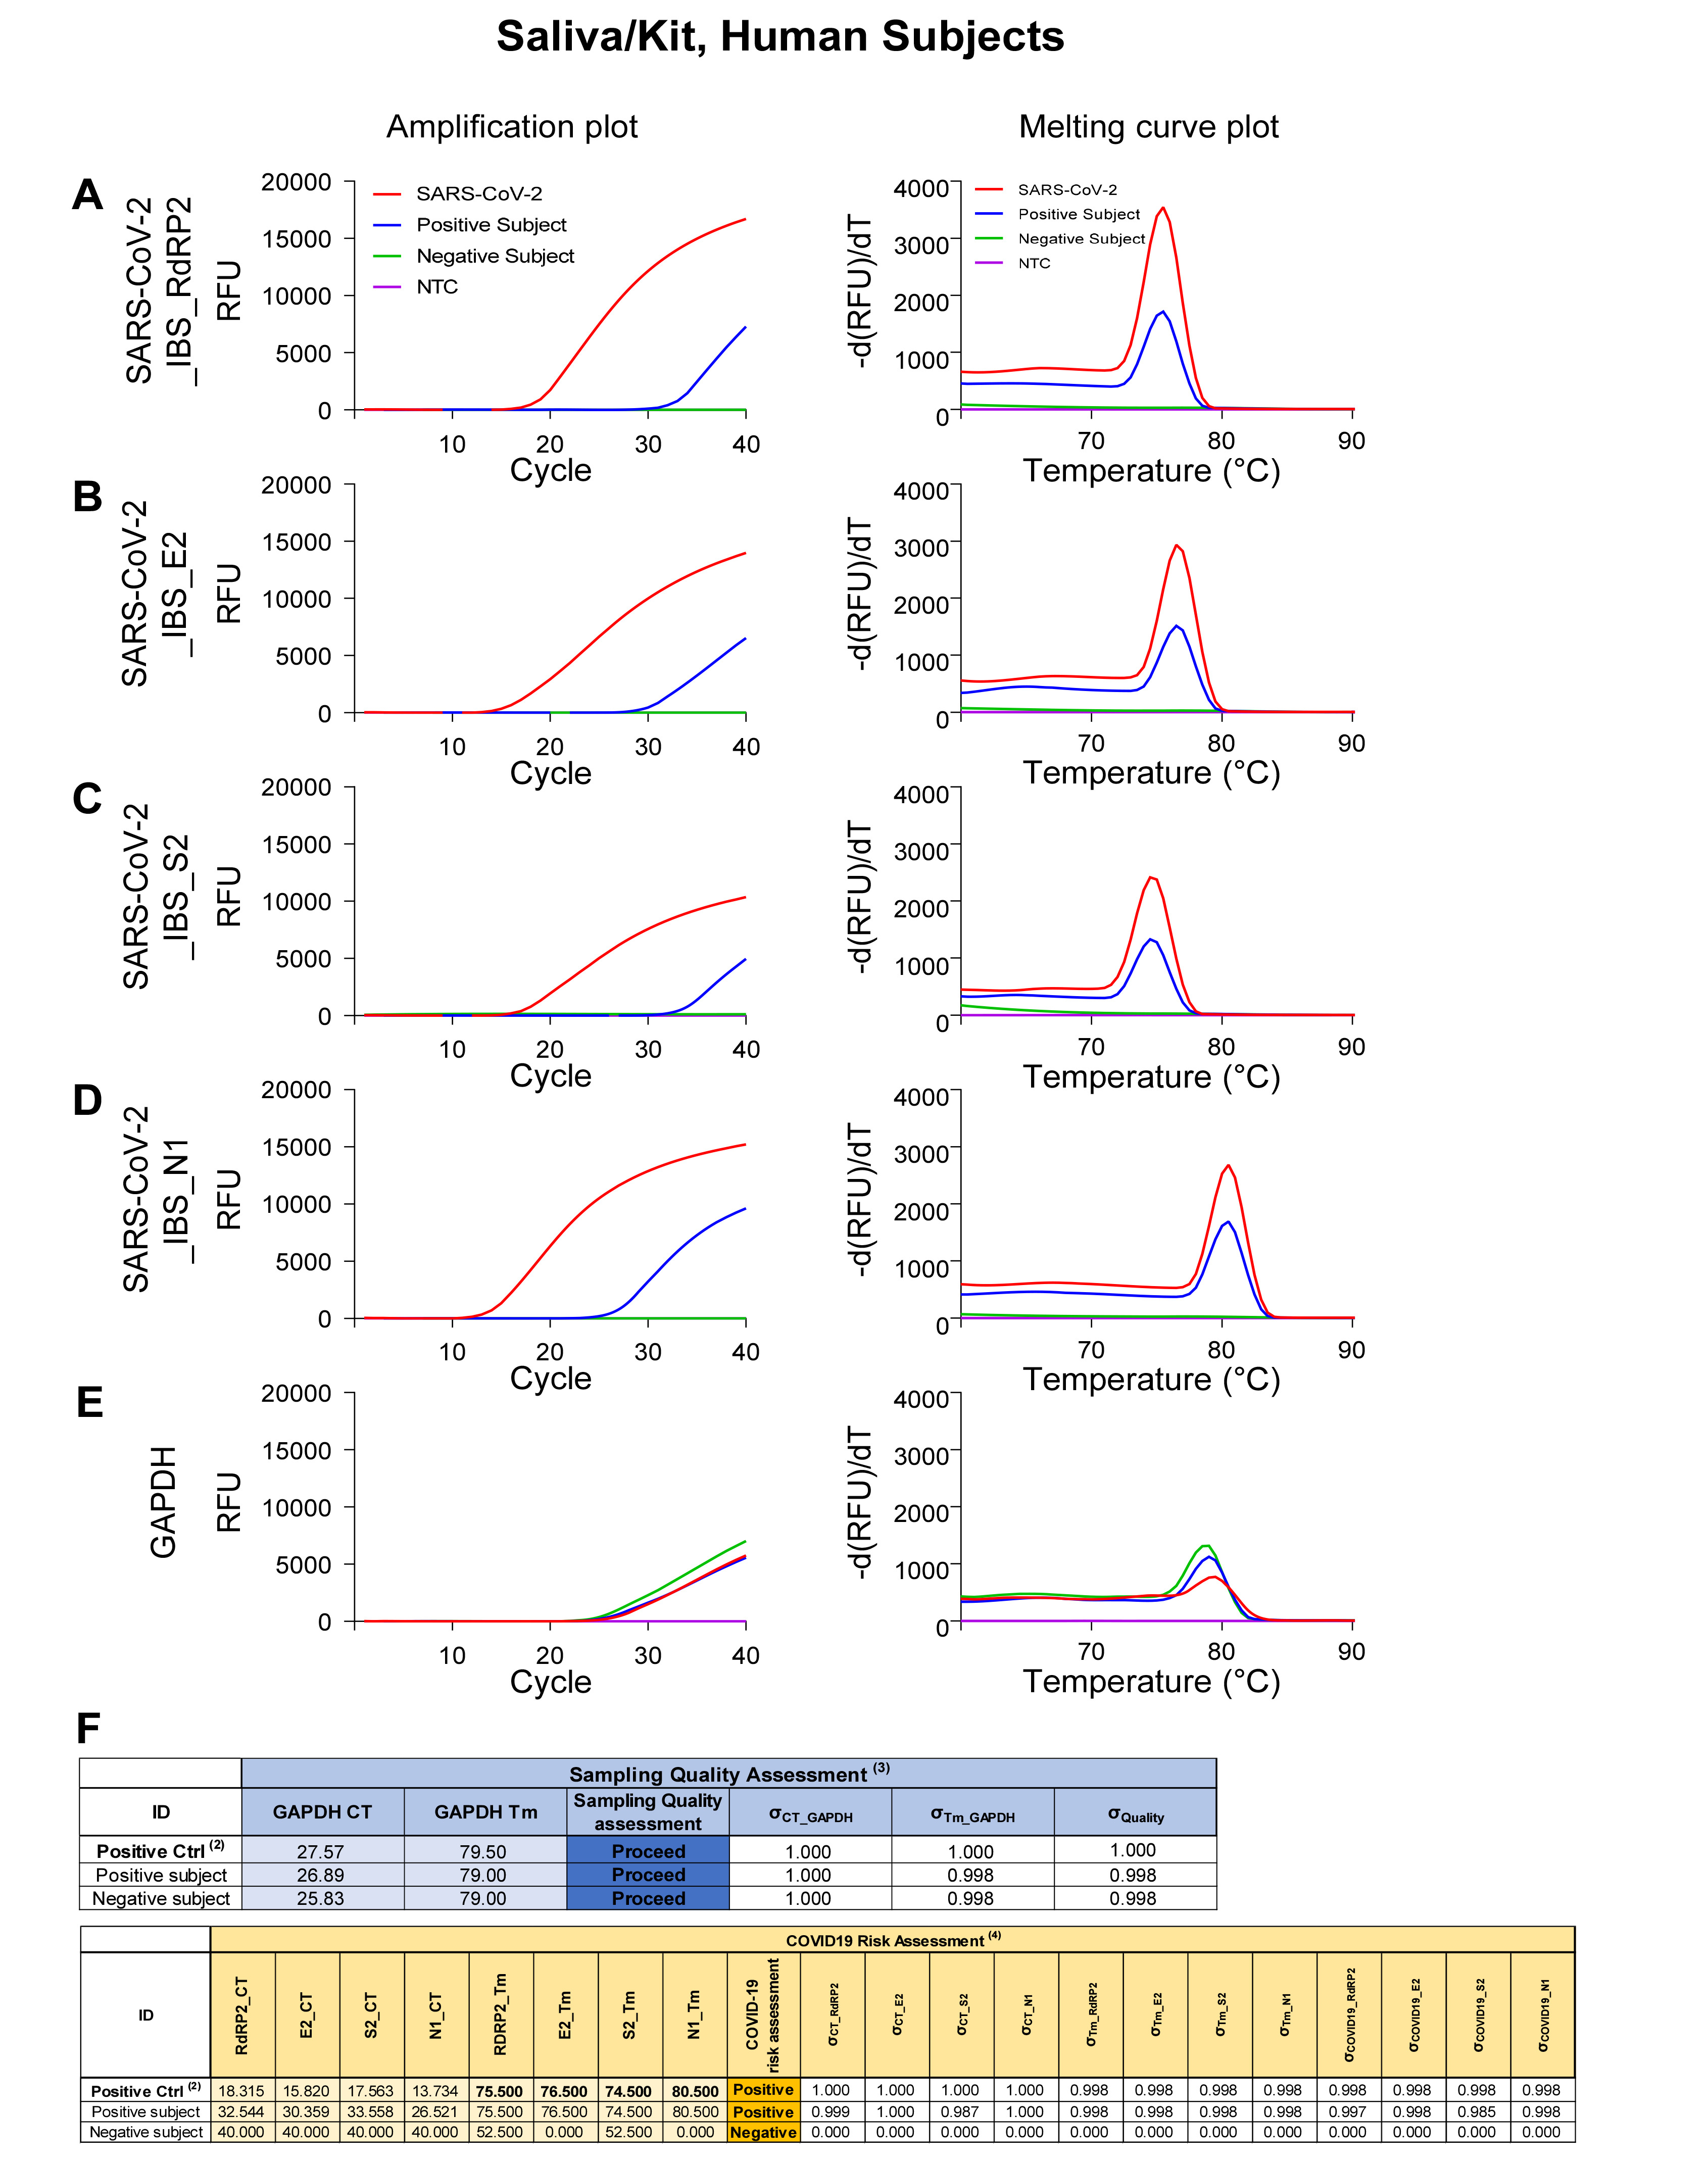
Fig. 9. Amplification and melting curve plot from Human Subject’s Saliva/Kit samples. Amplification plot (left panel) and melting curve plot (right panel) from qRT-PCR of human subjects saliva/Kit samples. To determine whether volunteers are infected to SARS-CoV-2, qRT-PCR was performed by using the previously reported SARS-CoV-2 primer sets; (A) SARS-CoV-2_IBS_RdRP2, (B) SARS-CoV-2_IBS_E2, (C) SARS-CoV-2_IBS_S2, (D) SARS-CoV-2_IBS_N1. (E) GAPDH primer set was used for IPC detection. Each color code represent individual subject result and SARS-CoV-2 amplification was represent as red color. (F) Sampling quality assessment and COVID-19 risk assessment with Automatic COVID-19 risk assessment in Supplementary Data 1.
© Exp Neurobiol