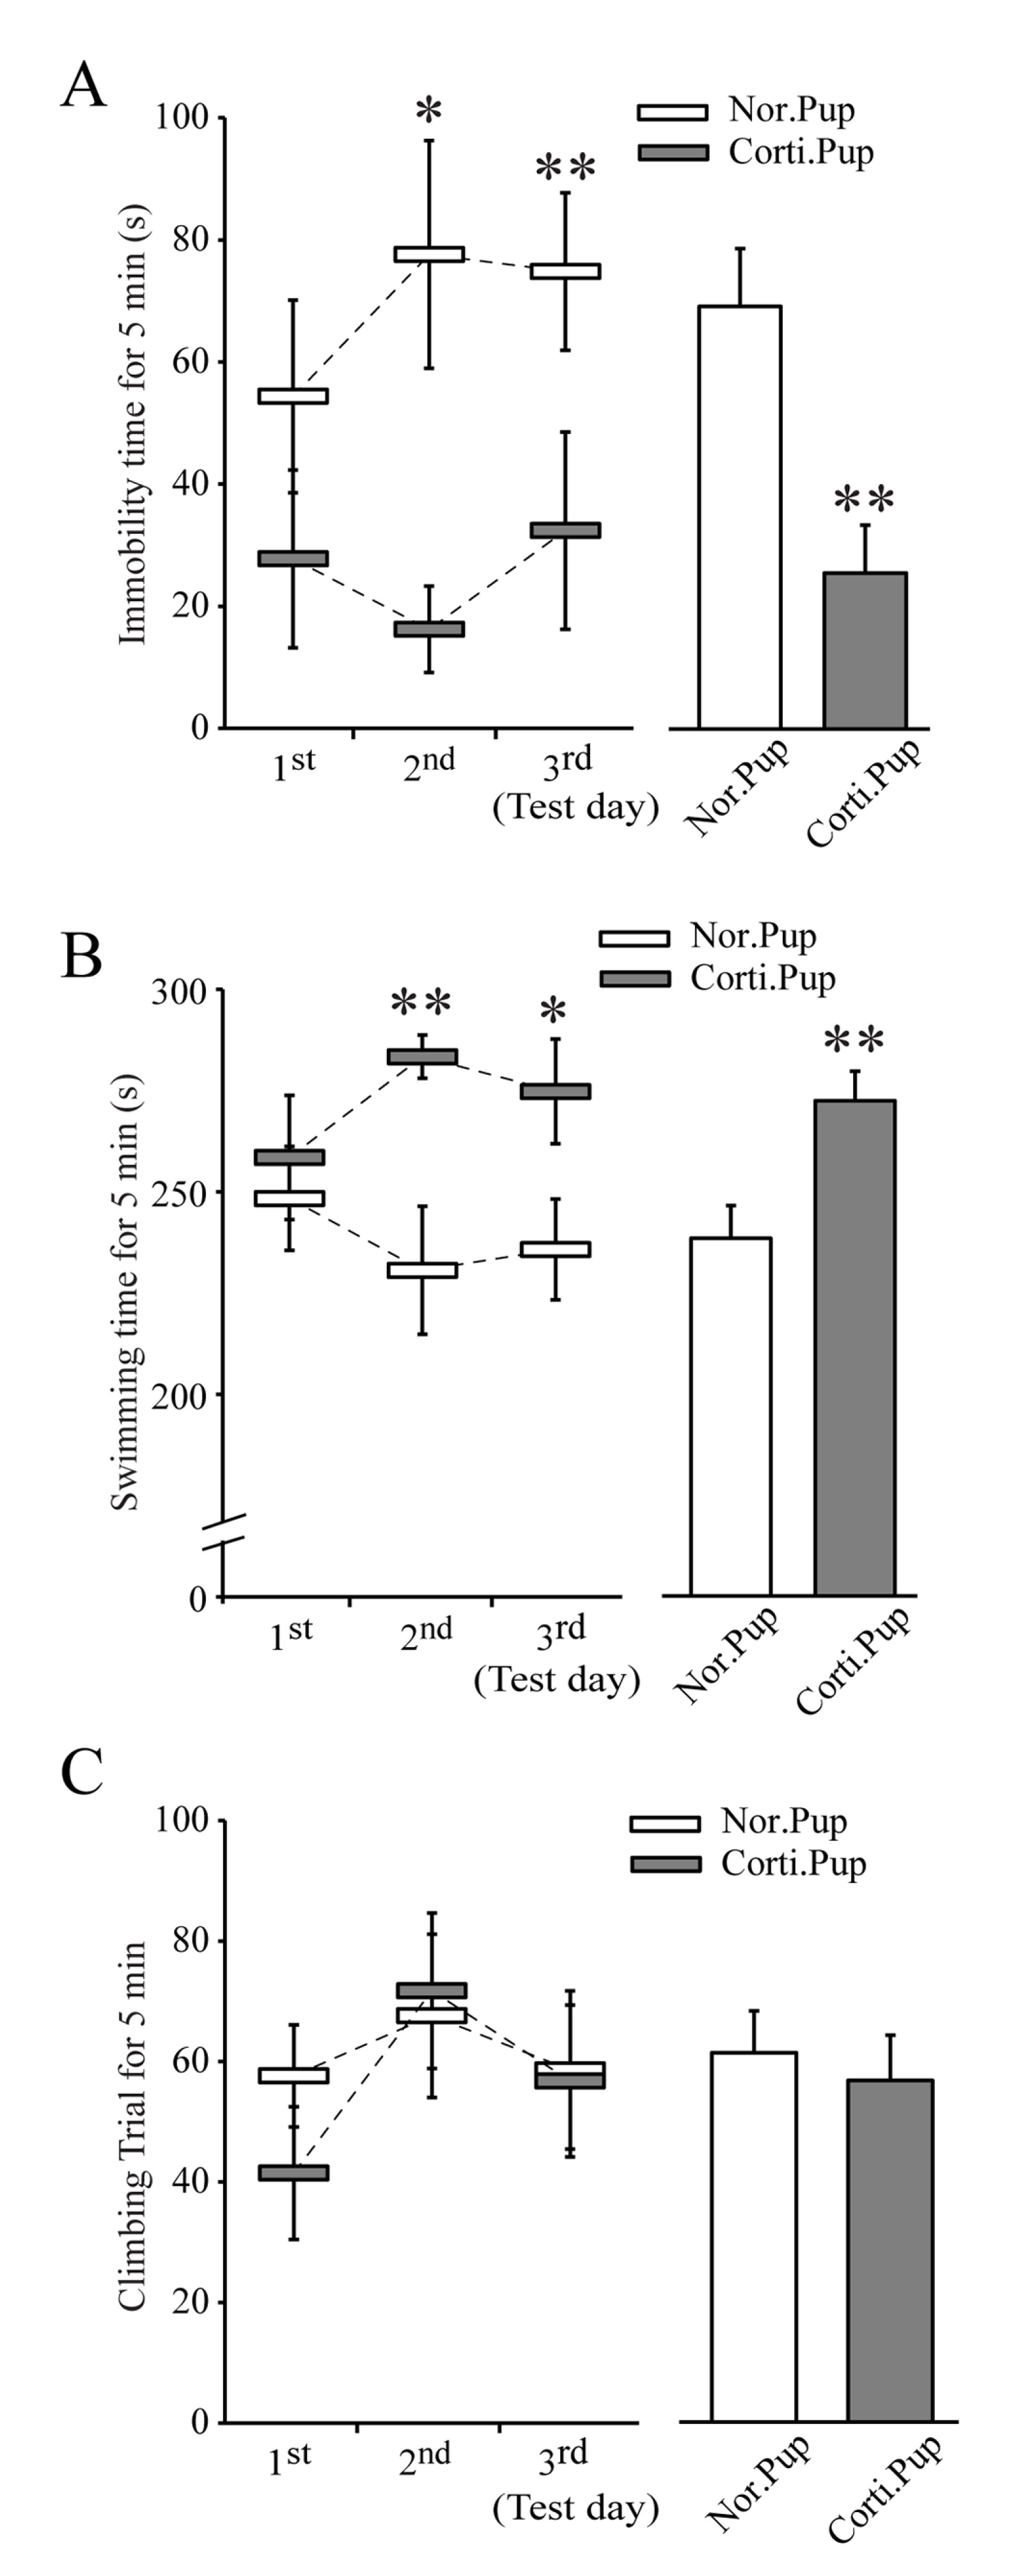
Fig. 3. Corti.Pups exhibit hyperactive behaviors in FS test. (A) The different changes of immobility time between two groups. Corti.Pups continuously moved and swam in FS test for three days of the test, so their immobility was significantly less than that of Nor.Pups. (B) The different changes of swimming time between two groups. (C) The number of climbing trials. Bar graphs in A, B and C indicate the averaged value for three test days. Data indicate the mean±S.E. *p<0.05; **p<0.01.
© Exp Neurobiol