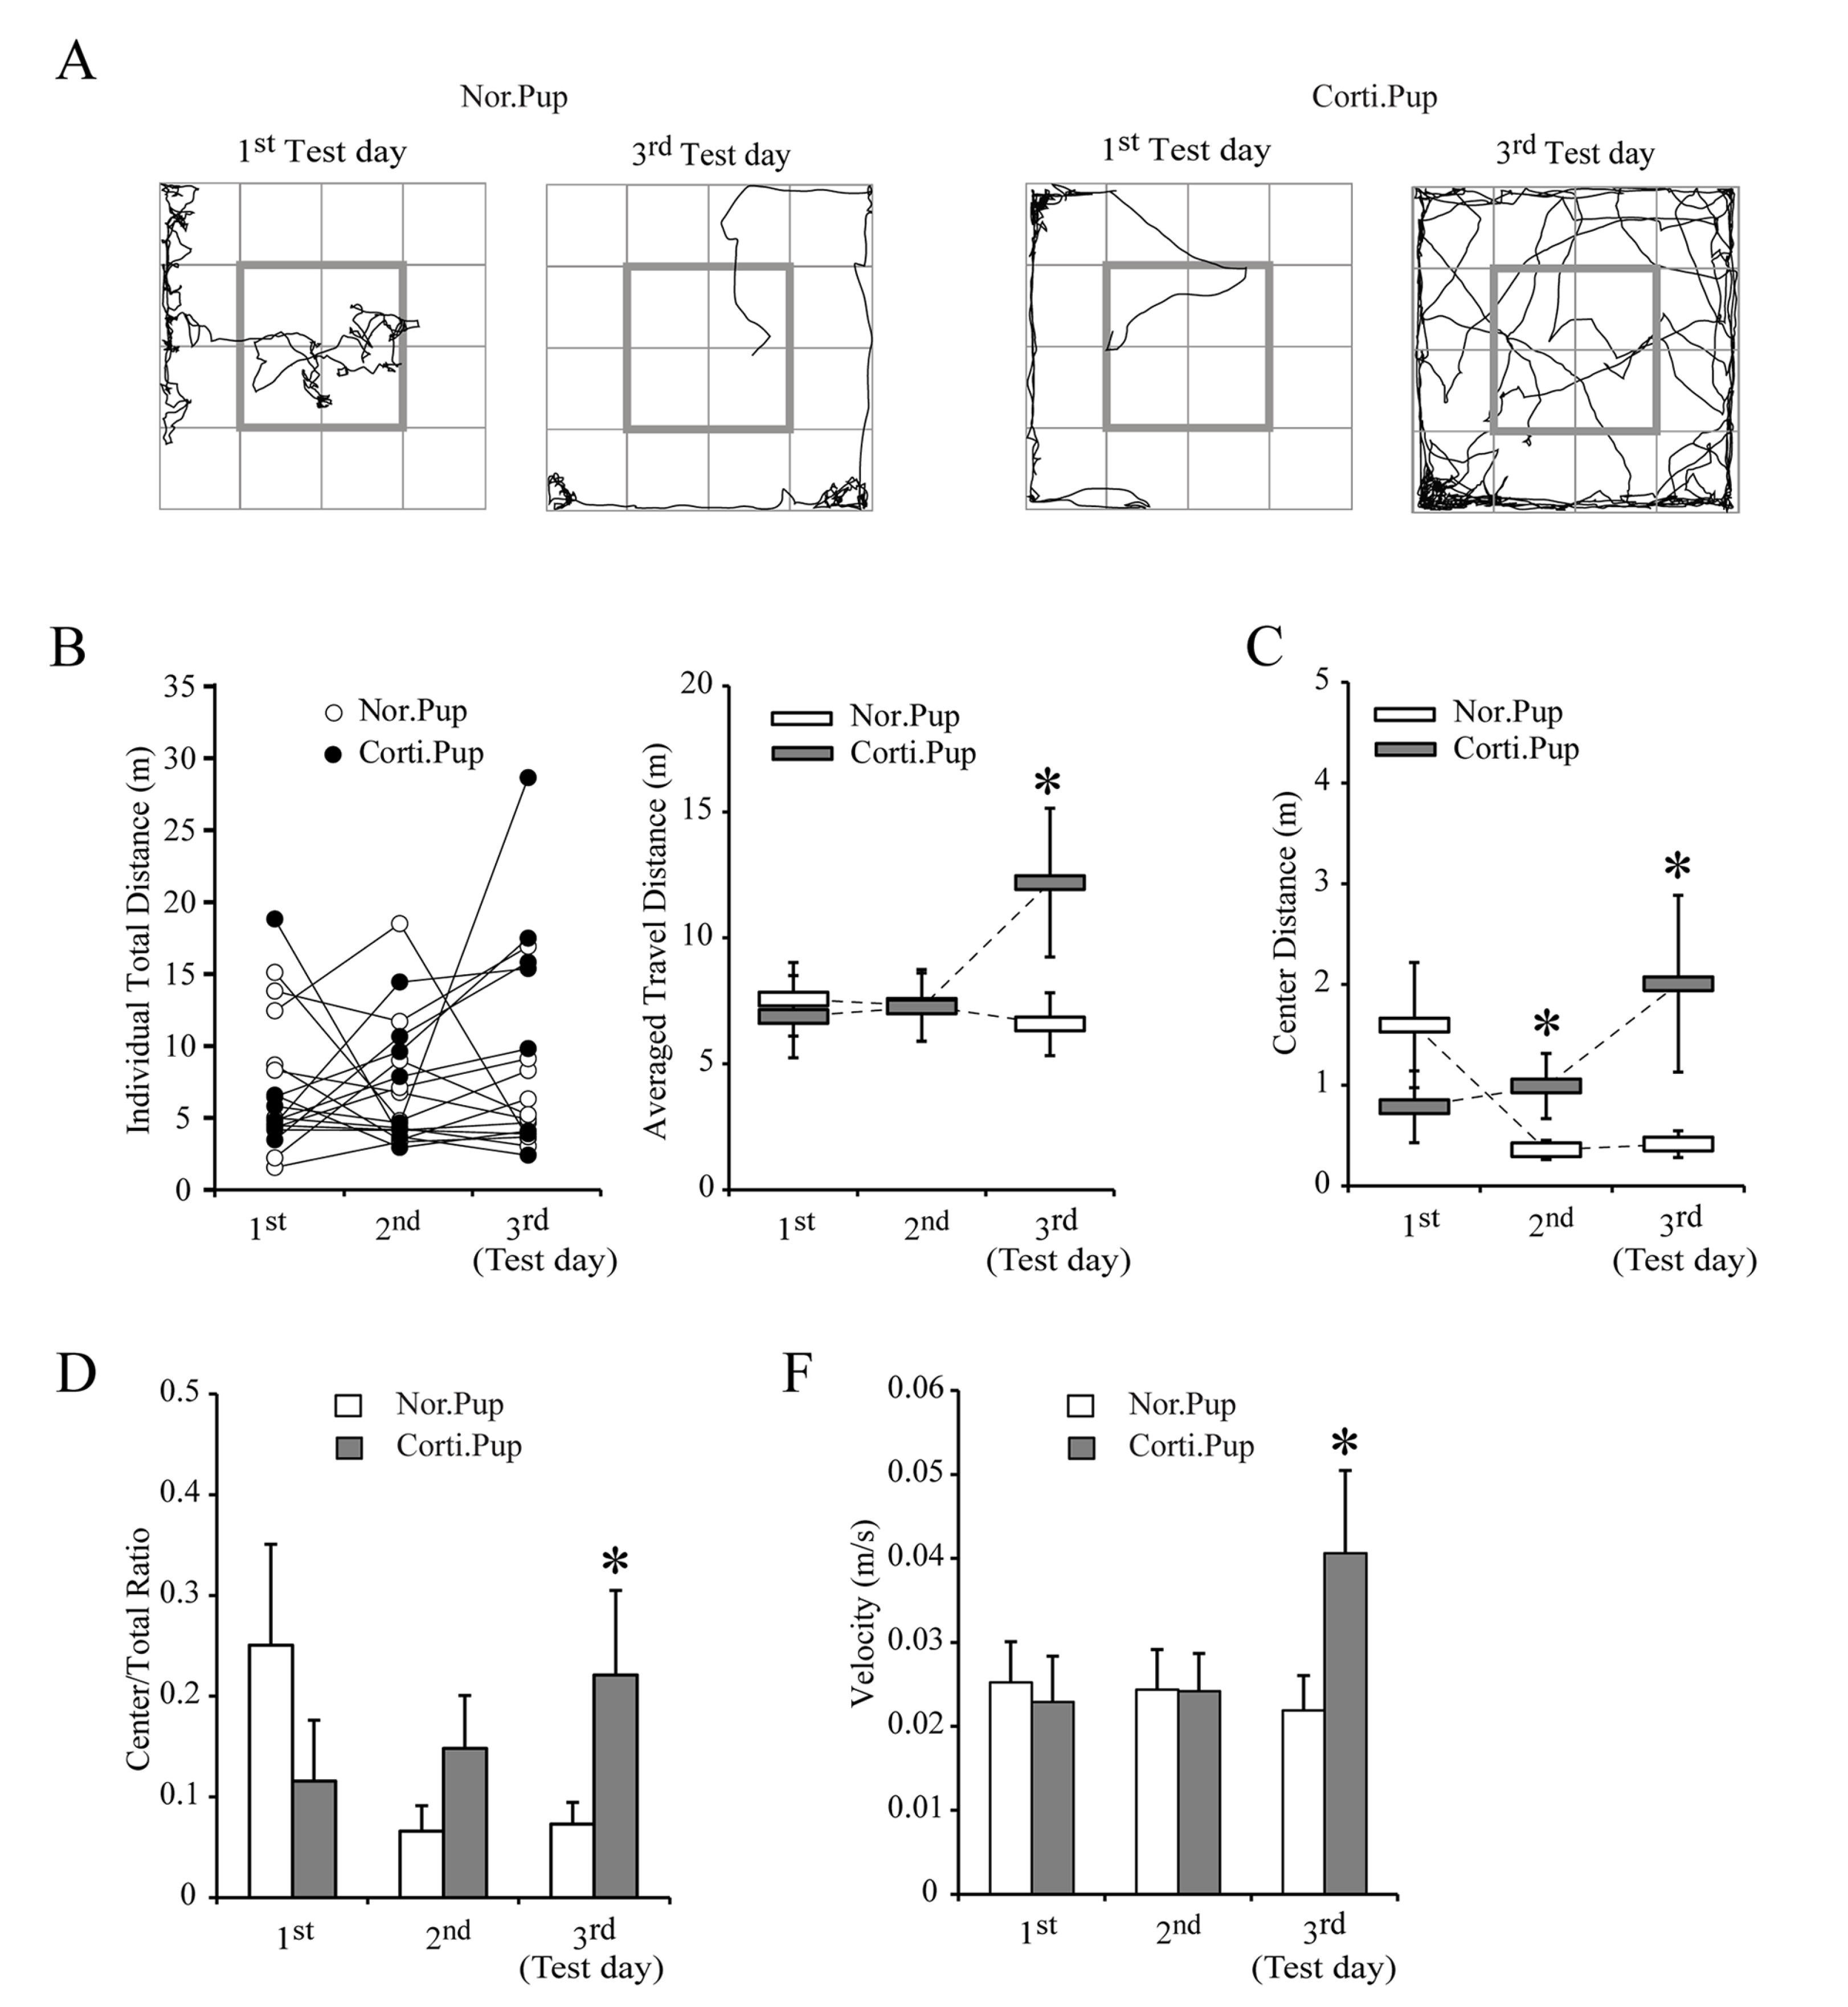
Fig. 4. Corti.Pups exhibit higher spontaneous locomotor activities in OF test. (A) Example traces of spontaneous movements in the open box. Four squares located in the center (bolded) were defined as ‘center area’. Traces were tracked by idTracker software. (B) Changes of total movement distance during the test. Corti.Pups showed the increased distance on the 3rd test day. (C) Changes of movement distance in the center area. The movement distance of Corti.Pups in the center area was significantly longer than that of Nor.Pups on the 2nd and 3rd test days. (D) The ratio of center distance to the total distance. The ratio of center movement in Corti.Pups was significantly increased on the 3rd test day. (E) Changes of movement velocity in OF test. Corti.Pups exerted the increased velocity while Nor.Pups showed consistent velocity during the test. Data indicate the mean±S.E. *p<0.05, **p<0.01.
© Exp Neurobiol