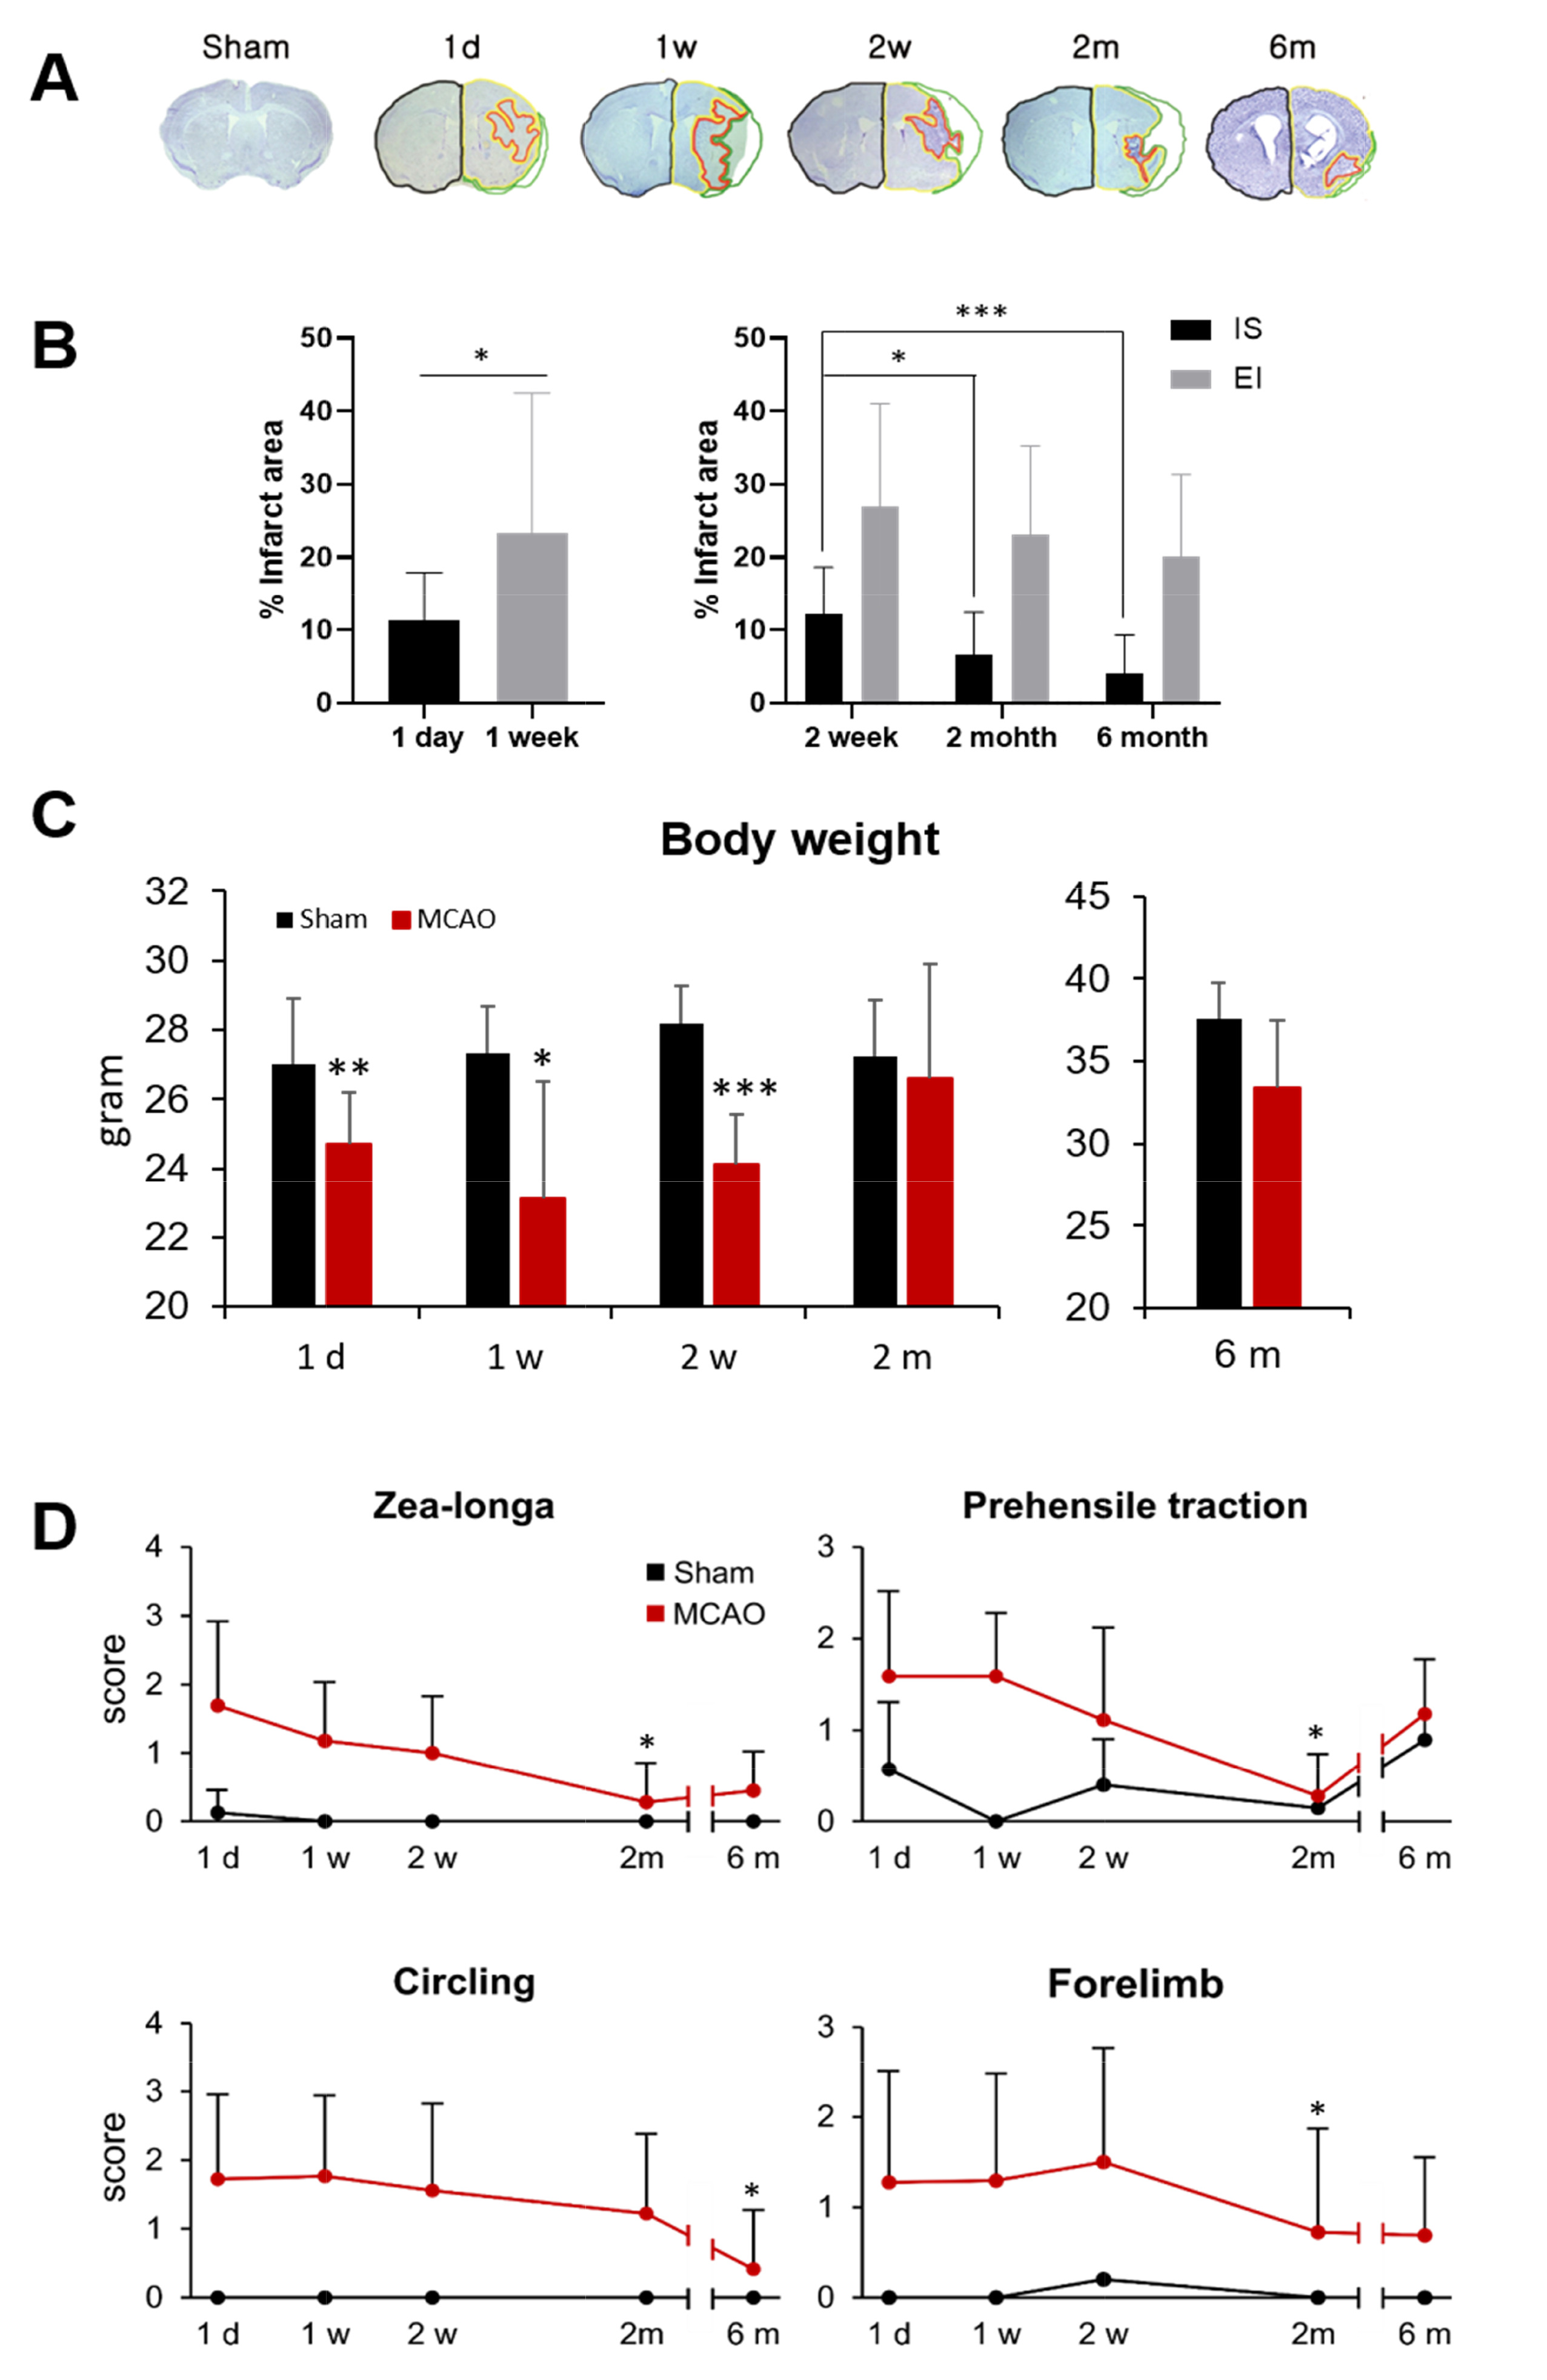
Fig. 1. Measurements of infarct volume, body weight, and NSS after tMCAO. (A, B) Assessment of tissue volume from one day to six months after tMCAO. NI (non-injured tissue, yellow); IS (ischemic scar tissue, red); T (total ipsilateral tissue=NI+IS); EI (estimated infarct tissue) was calculated by subtracting total ipsilateral volume from total contralateral volume (black line) (namely differences between the hemispheres, green). Numbers of tMCAO mice at 1 d (n=9), 1 w (n=7), 2 w (n=11), 2 m (n=13), and 6 m (n=10). (C) The body weights were measured. Numbers of mice were (n=sham/tMCAO): 1 d (n=8/17), 1 w (n=5/12), 2 w (n=5/11), 2 m (n=7/18), and 6 m (n=9/29). p values were determined using a two-tailed Student’s t-test. *p≤0.05, **p≤0.01, and ***p≤0.001. (D) Evaluation of neurological impairment using NSS. The scores of the mice assessed at each time point were averaged. Number of mice were (n=sham/tMCAO): 1 d (n=8/29), 1 w (n=5/17), 2 w (n=5/9), 2 m (n=7/18), 6 m (n=9/29). Data were compared with that on day one after stroke: *p≤0.05.
© Exp Neurobiol