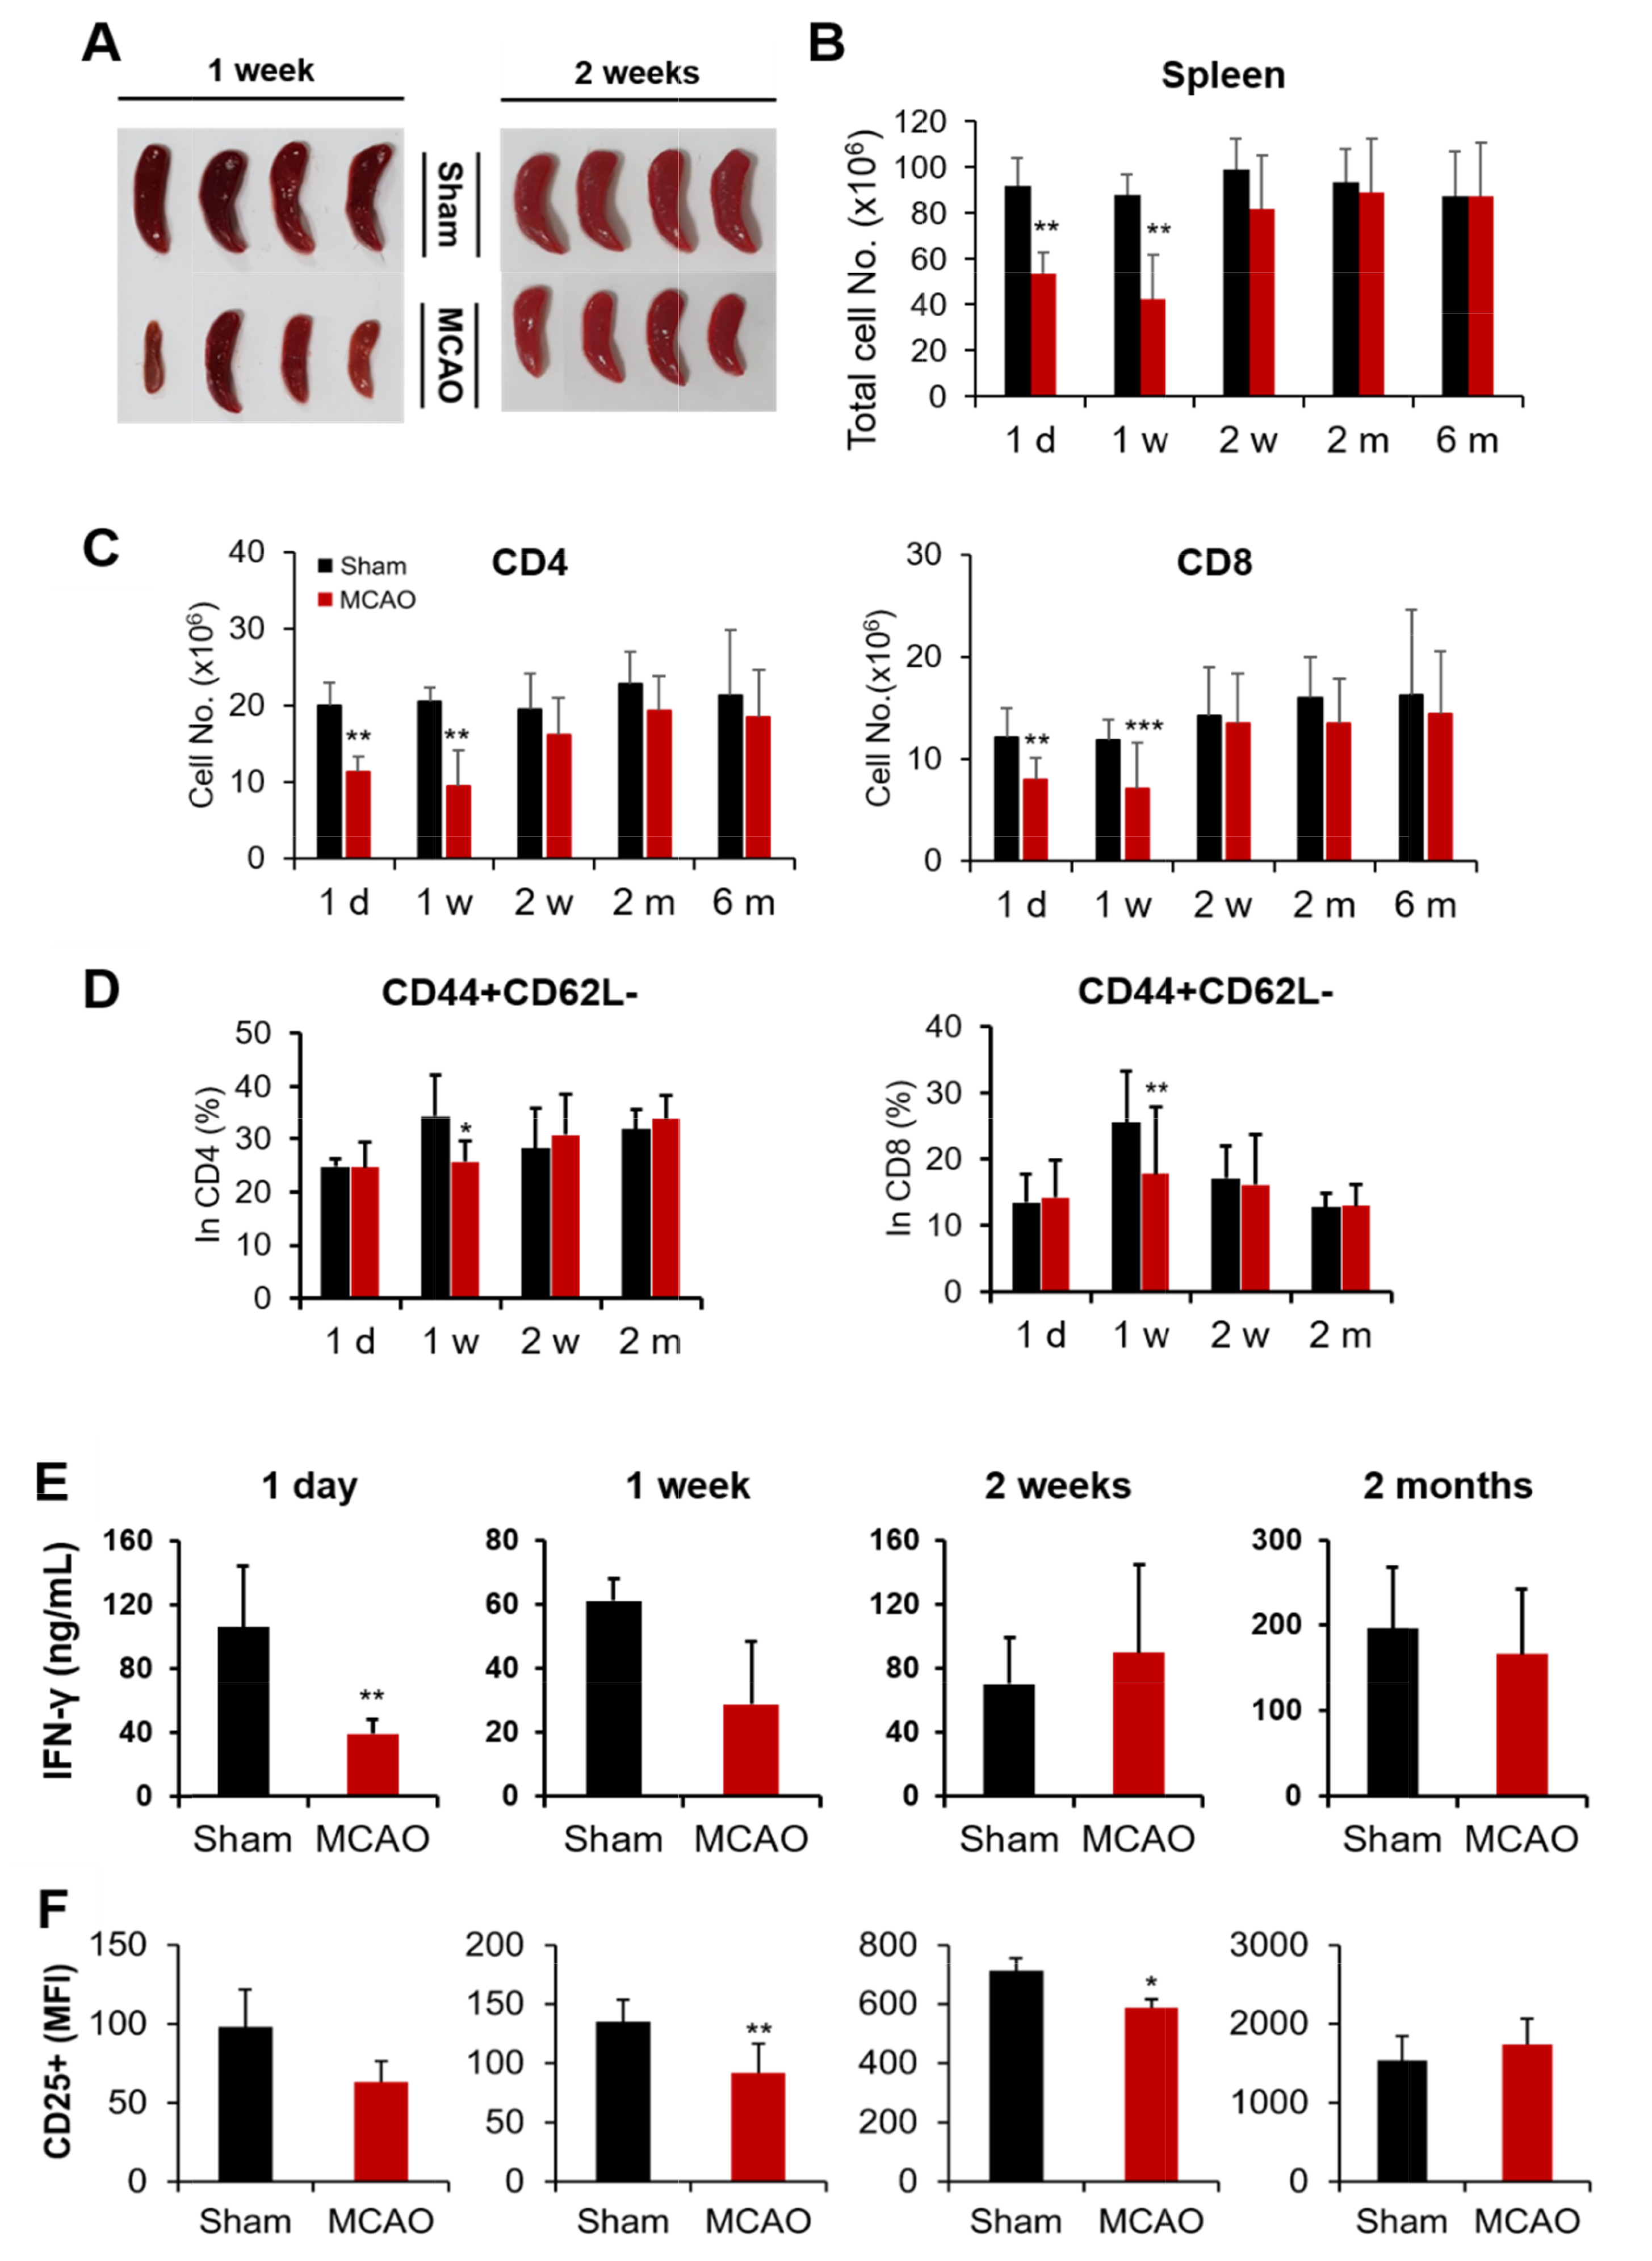
Fig. 4. T lymphocyte population and phenotype in the spleen after tMCAO. (A) Representative spleen size and morphological analysis for sham and tMCAO mice at one and two weeks after stroke. (B) Total cell number and (C) CD4+ and CD8+ T lymphocytes were counted. (D) CD44+ CD62L- effector cells were analyzed in CD4+ and CD8+ T lymphocytes. Mice numbers were (n=sham/tMCAO): 1 d (n=6/7), 1 w (n=6/9), 2 w (n=8/12), 2 m (n=13/15), and 6 m (n=7/26). (E) Splenocytes were stimulated with 0.1 μg/ml α-CD3 and α-CD28 antibodies. IFN-γ (ng/ml) levels in the cell culture supernatant were measured using ELISA after 48 h of stimulation. (F) The stimulated T lymphocytes were stained with CD4 and CD25 antibodies, and their fluorescence intensities were analyzed using flow cytometry. Mice numbers were (n=sham/tMCAO): 1 d (n=5/7), 1 w (n=4/3), 2 w (n=5/5), and 2 m (n=7/6). *p≤0.05, **p≤0.01, and ***p≤0.001.
© Exp Neurobiol