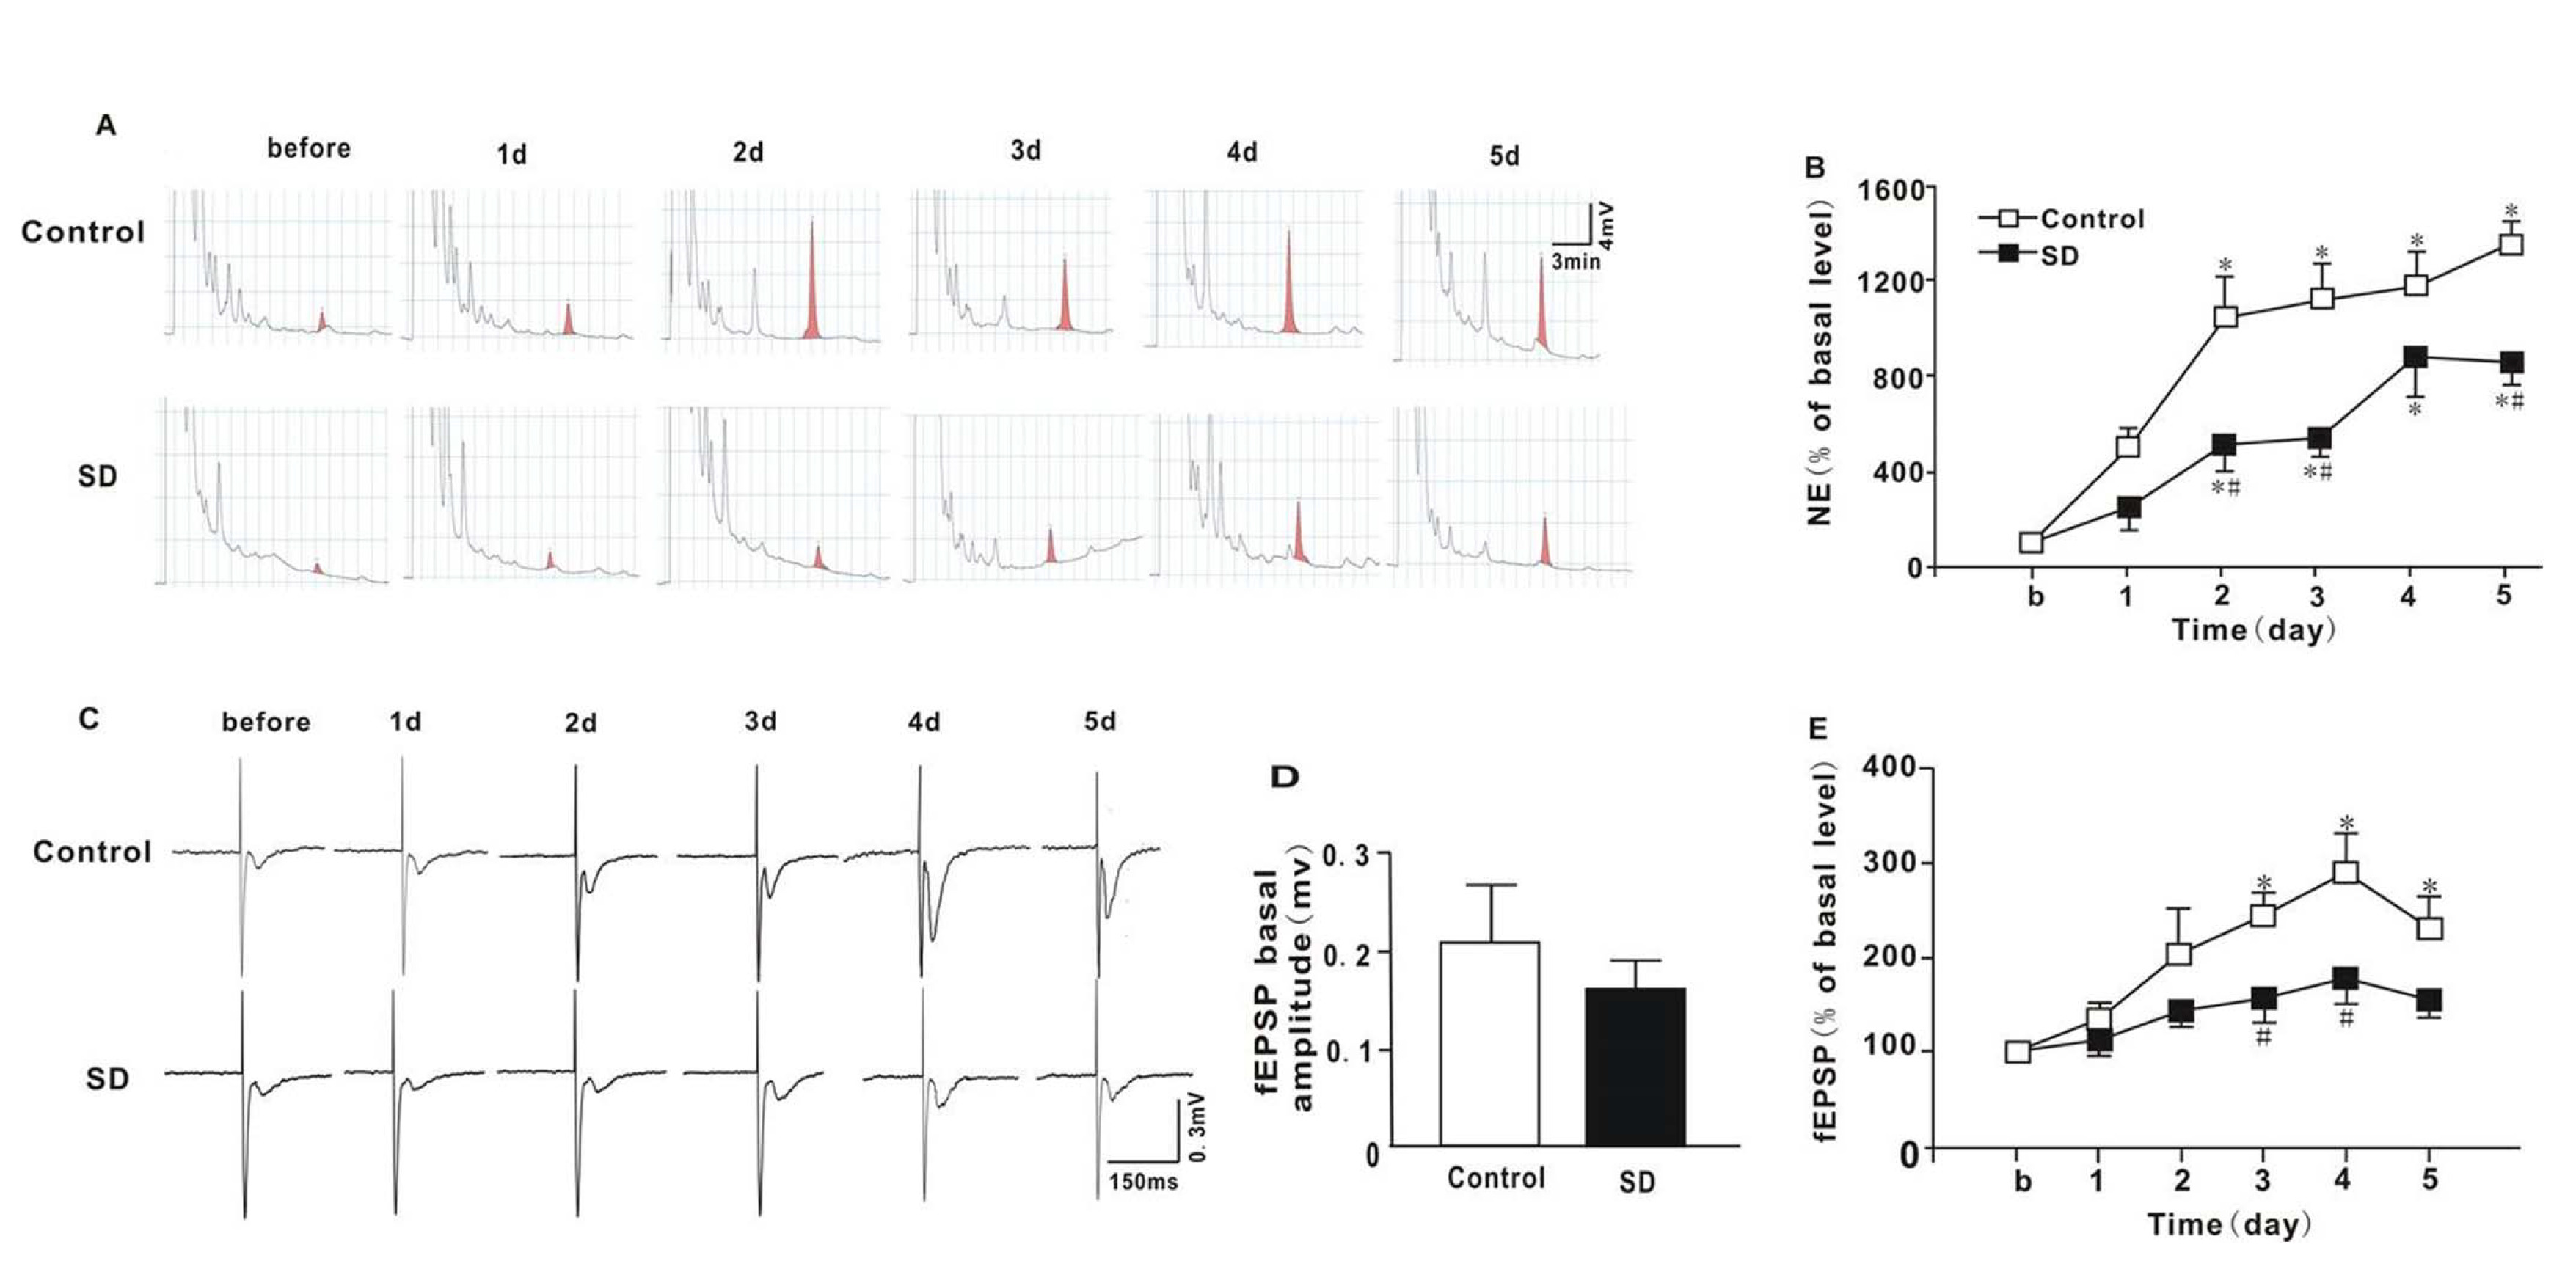
Fig. 4. Effects of SD on NE concentration and fEPSP amplitude in hippocampal DG region during MWM test. (A) Everyday typical HPLC-ECD chromatogram of the NE during MWM test, (B) Summary of changes of NE level, (C) Everyday typical fEPSP waveform in the DG during MWM test, (D) Basal fEPSP amplitude and (E) Amplitude of fEPSP in DG in SD rats during MWM test. ‘b’ indicates before starting the behavioral test. NE levels and fEPSP amplitudes are expressed as percentage of basal levels. Data are presented as mean±SEM (n=6 in each group). *p<0.05 vs. basal level. #p<0.05 vs. control group. fEPSP, field excitatory postsynaptic potential; NE, norepinephrine.
© Exp Neurobiol