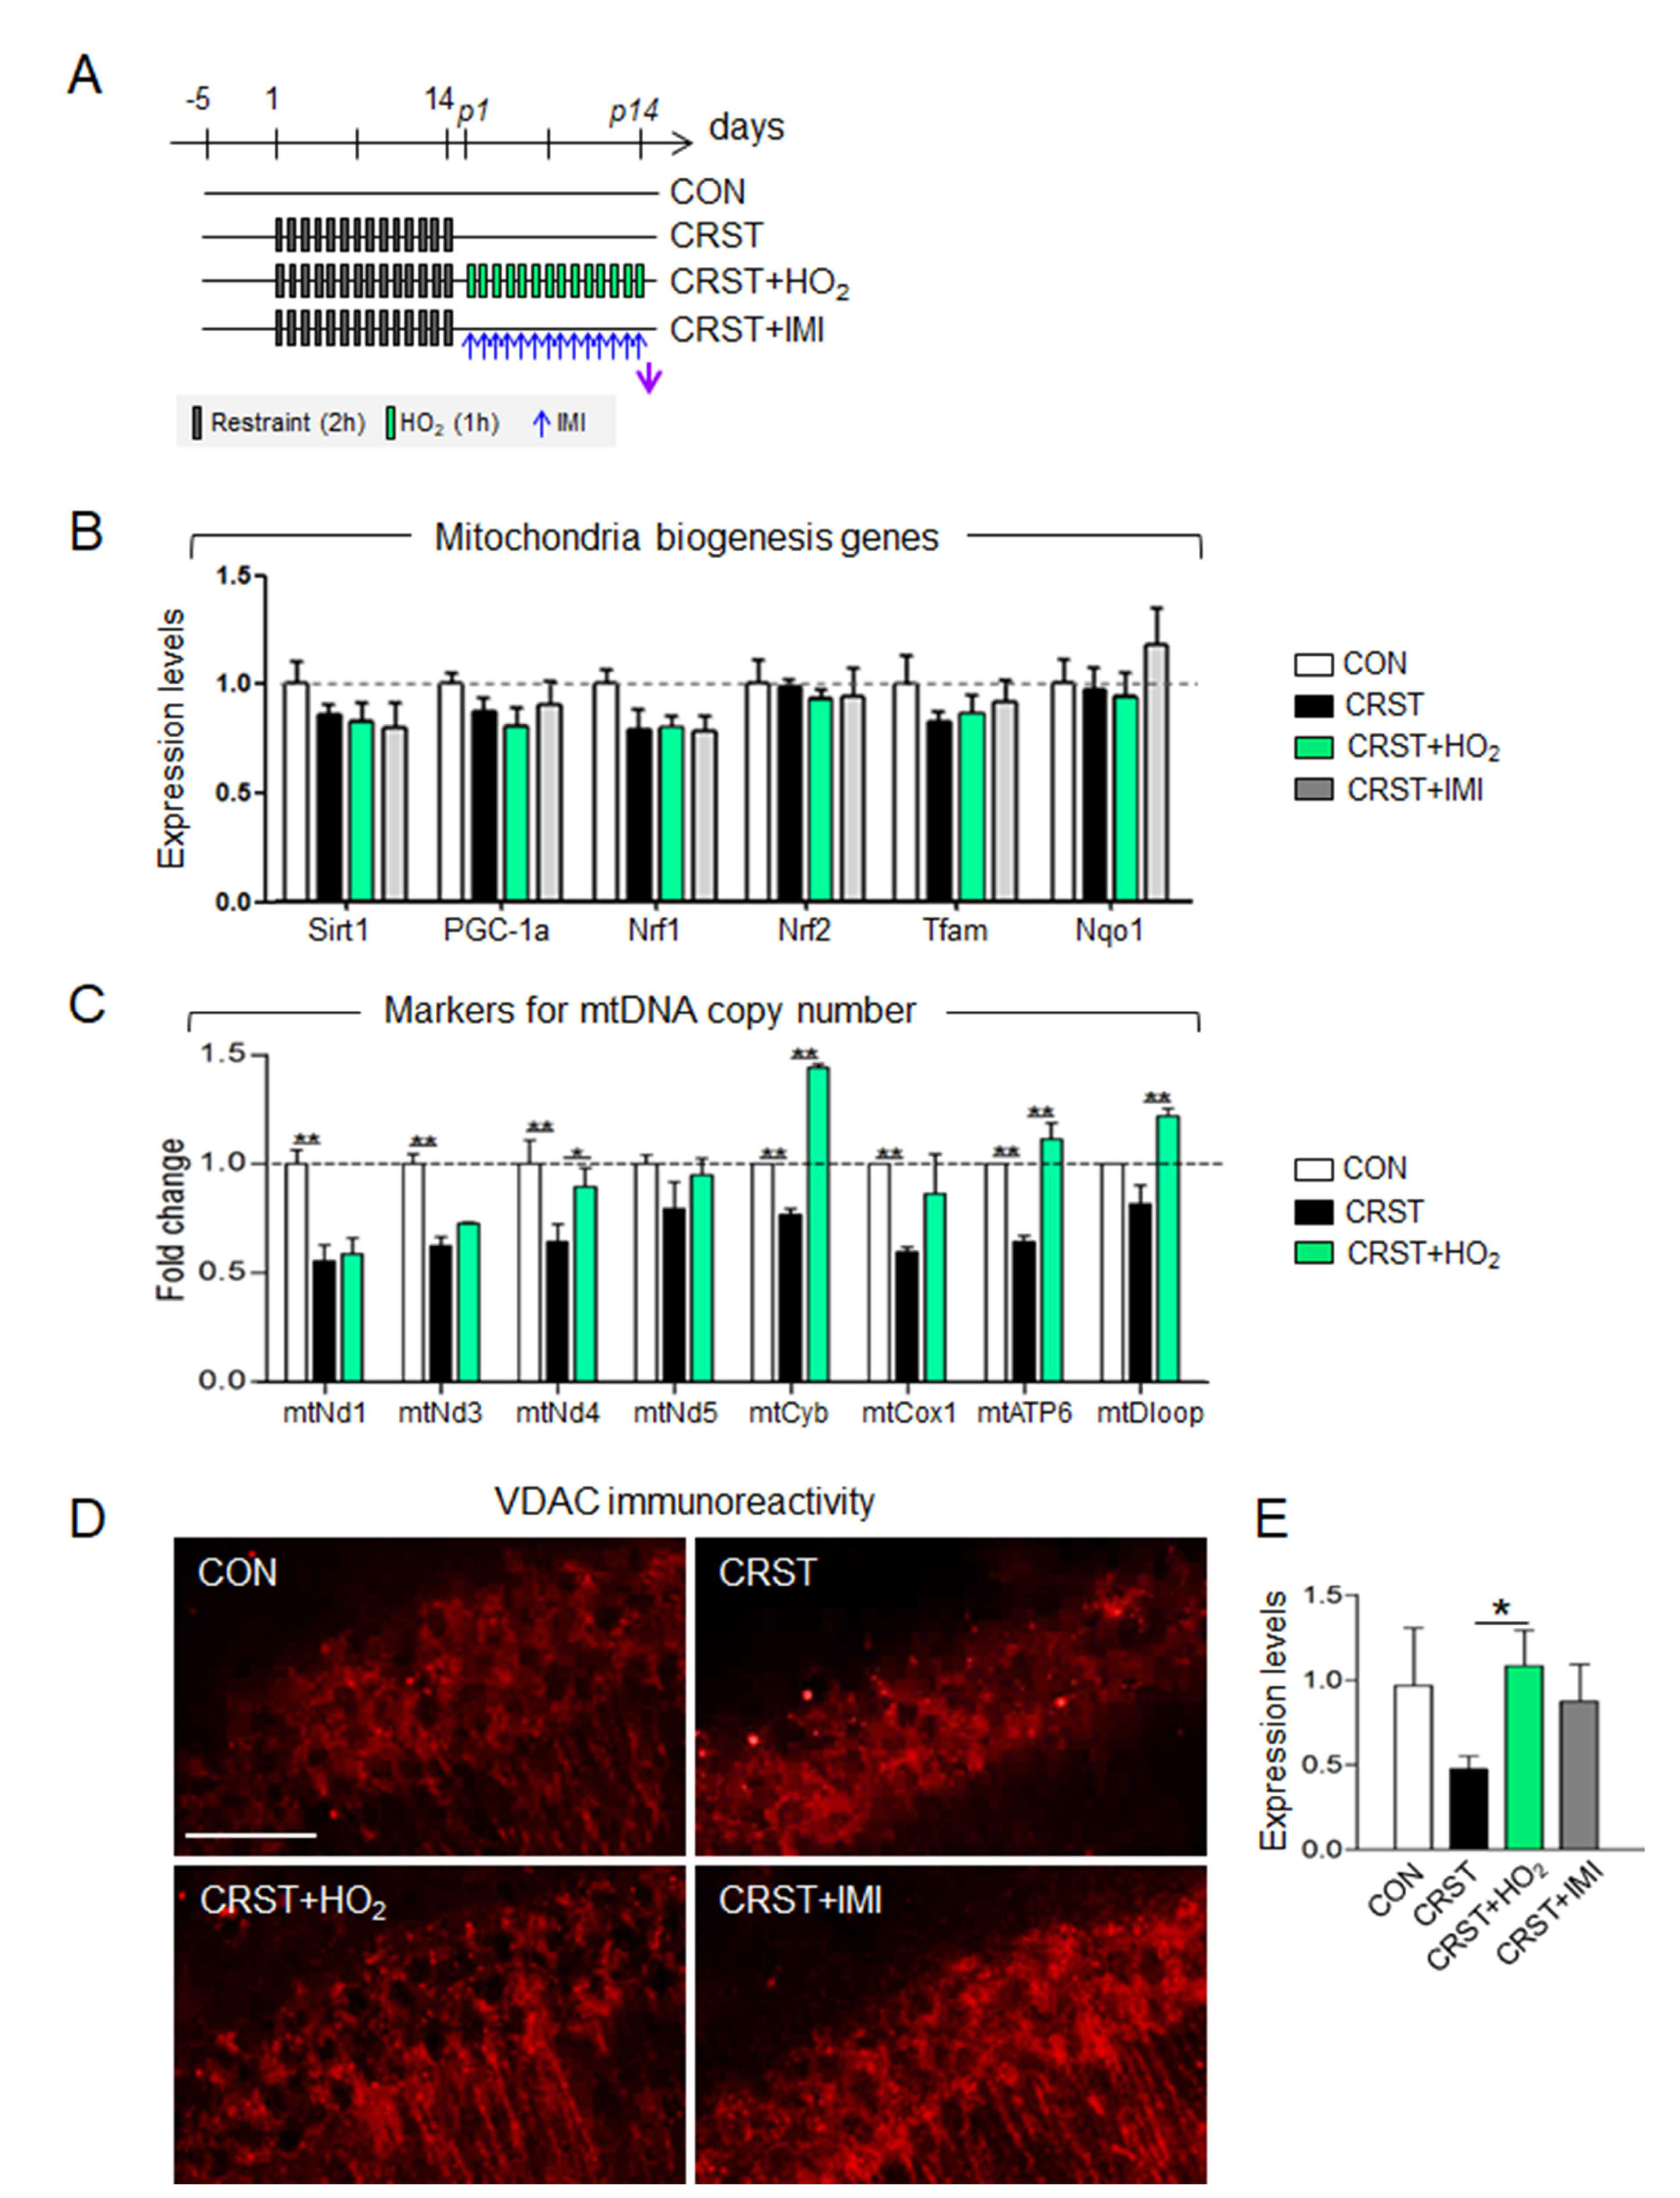
Fig. 5. HO2 treatment rescued stress-induced reduced mtDNA copy numbers in the hippocampus. (A) Experimental design. CRST mice were treated with the 14-day, 2.0-ATA HO2 regimen or imipramine (IMI; 20 mg/kg/day, i.p.) as depicted. HO2: 100% O2 was treated for 1 h daily for indicated days. Red arrow, time point for tissue preparation. (B) Transcript levels of Sirt1, PGC-1a, Nrf1, Nrf2, Tfam, and Nqo1 in the hippocampus of control, CRST mice, CRST mice treated with the 14-day HO2 regimen, and CRST mice treated with IMI. n=6~8 animals per group and 6 PCR repeats per group. (C) PCR amplification levels of the mtDNA copy number markers of mt-Nd1, mt-Nd3, mt-Nd4, mt-Nd5, mt-Cyb, mt-Cox1, mt-Atp6, and mt-Dloop in the hippocampus of control, CRST mice, and CRST mice treated with the 14-day HO2 regimen. n=8 animals per group and 4~6 PCR repeats for each. (D, E) Photomicrographs showing VDAC expression in the pyramidal cell layer of the CA1 of the hippocampus (D) of the indicated groups. Quantification of VDAC expression levels (E). Scale bar; 50 µm. n=6 animals per group. Mean±SEM. *,**difference between indicated group. *p<0.05, **p<0.01 (one-way ANOVA and Newman-Keuls post hoc test).
© Exp Neurobiol