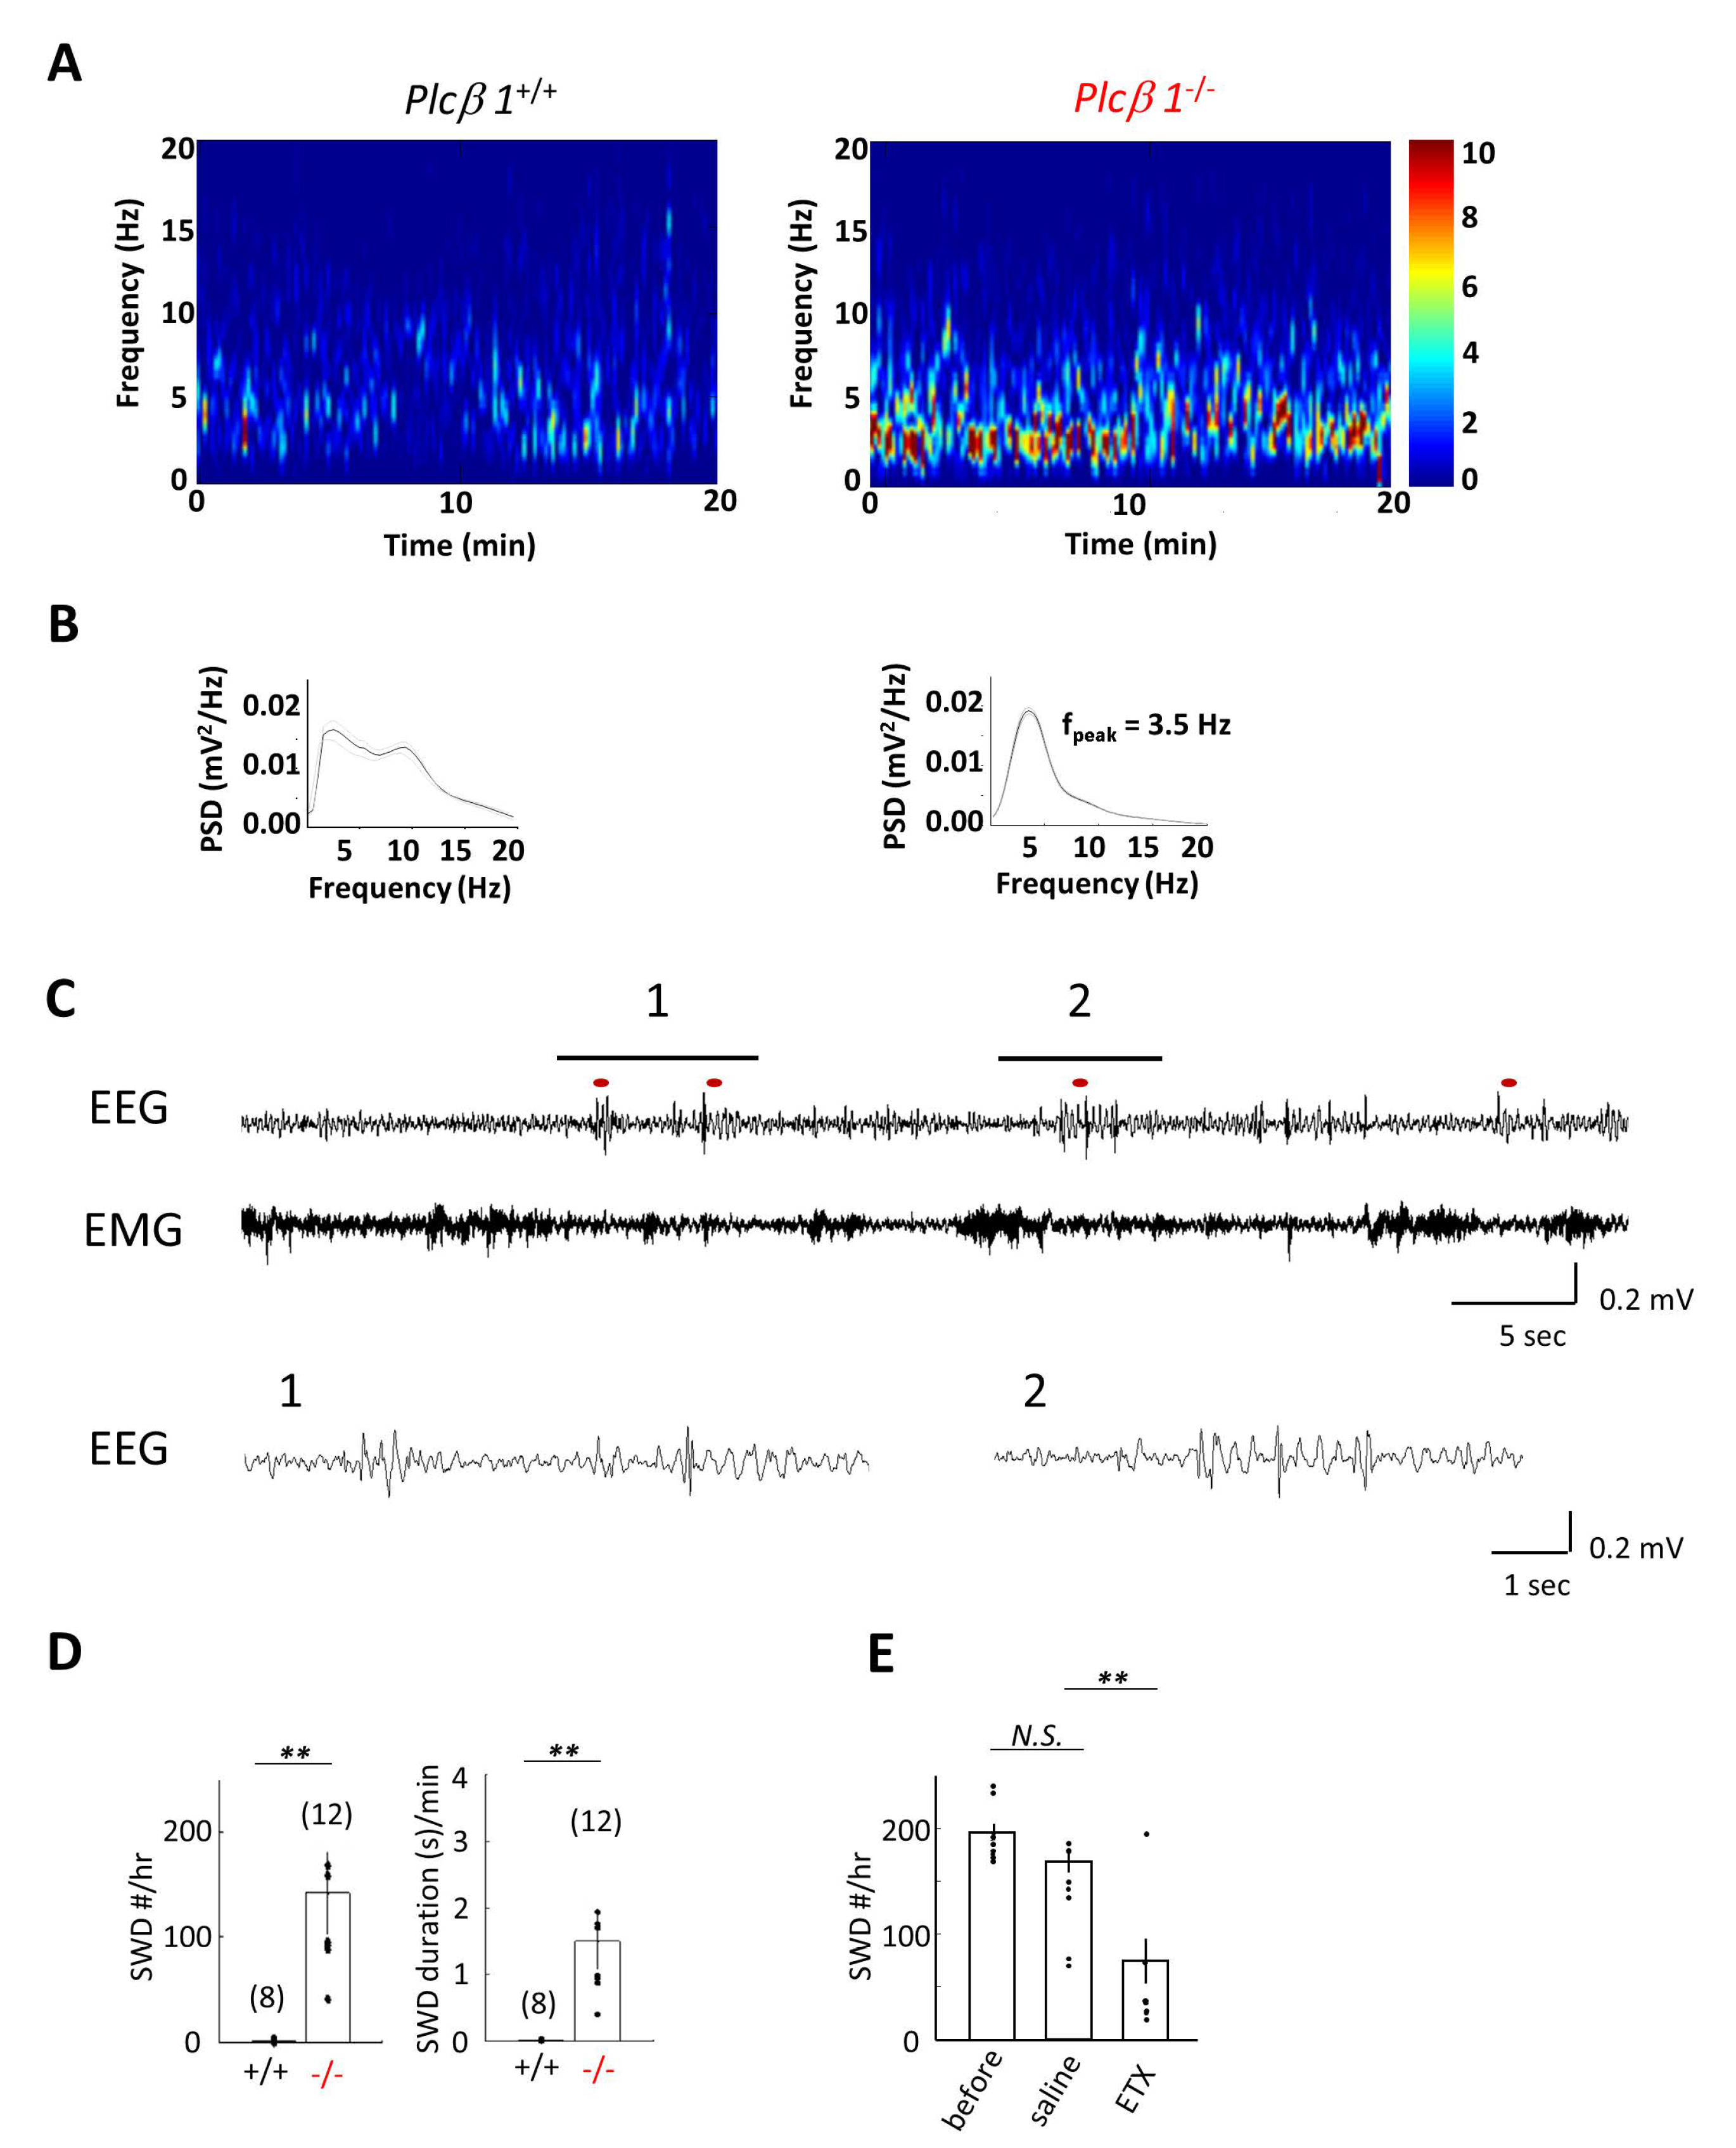
Fig. 1. Plcβ1-deficient mice exhibit complex abnormal EEG patterns. (A) Average EEG power spectrograms of Plcβ1+/+ and Plcβ1-/- mice during a 20 min recording. (B) Power analysis of spontaneous SWDs in Plcβ1-/- mice showed a peak frequency at 3.5 Hz. (C) Representative EEG and EMG traces from Plcβ1+/+ and Plcβ1-/- mice. Synchronized SWDs were observed in the frontal cortices of Plcβ1-/- mice. (D) Summary graphs of the total numbers (left) and average durations (right) of SWDs in Plcβ1+/+ and Plcβ1-/- mice; two-tailed Student’s t test. (E) Comparison of the number of SWDs before and after ETX administration. Data are presented as the mean±SEM (n.sp>0.05, *p<0.001, **p<0.05; two-tailed Student’s paired t test). For all data, n=8 for the control group and n=12 for the Plcβ1-/- group.
© Exp Neurobiol