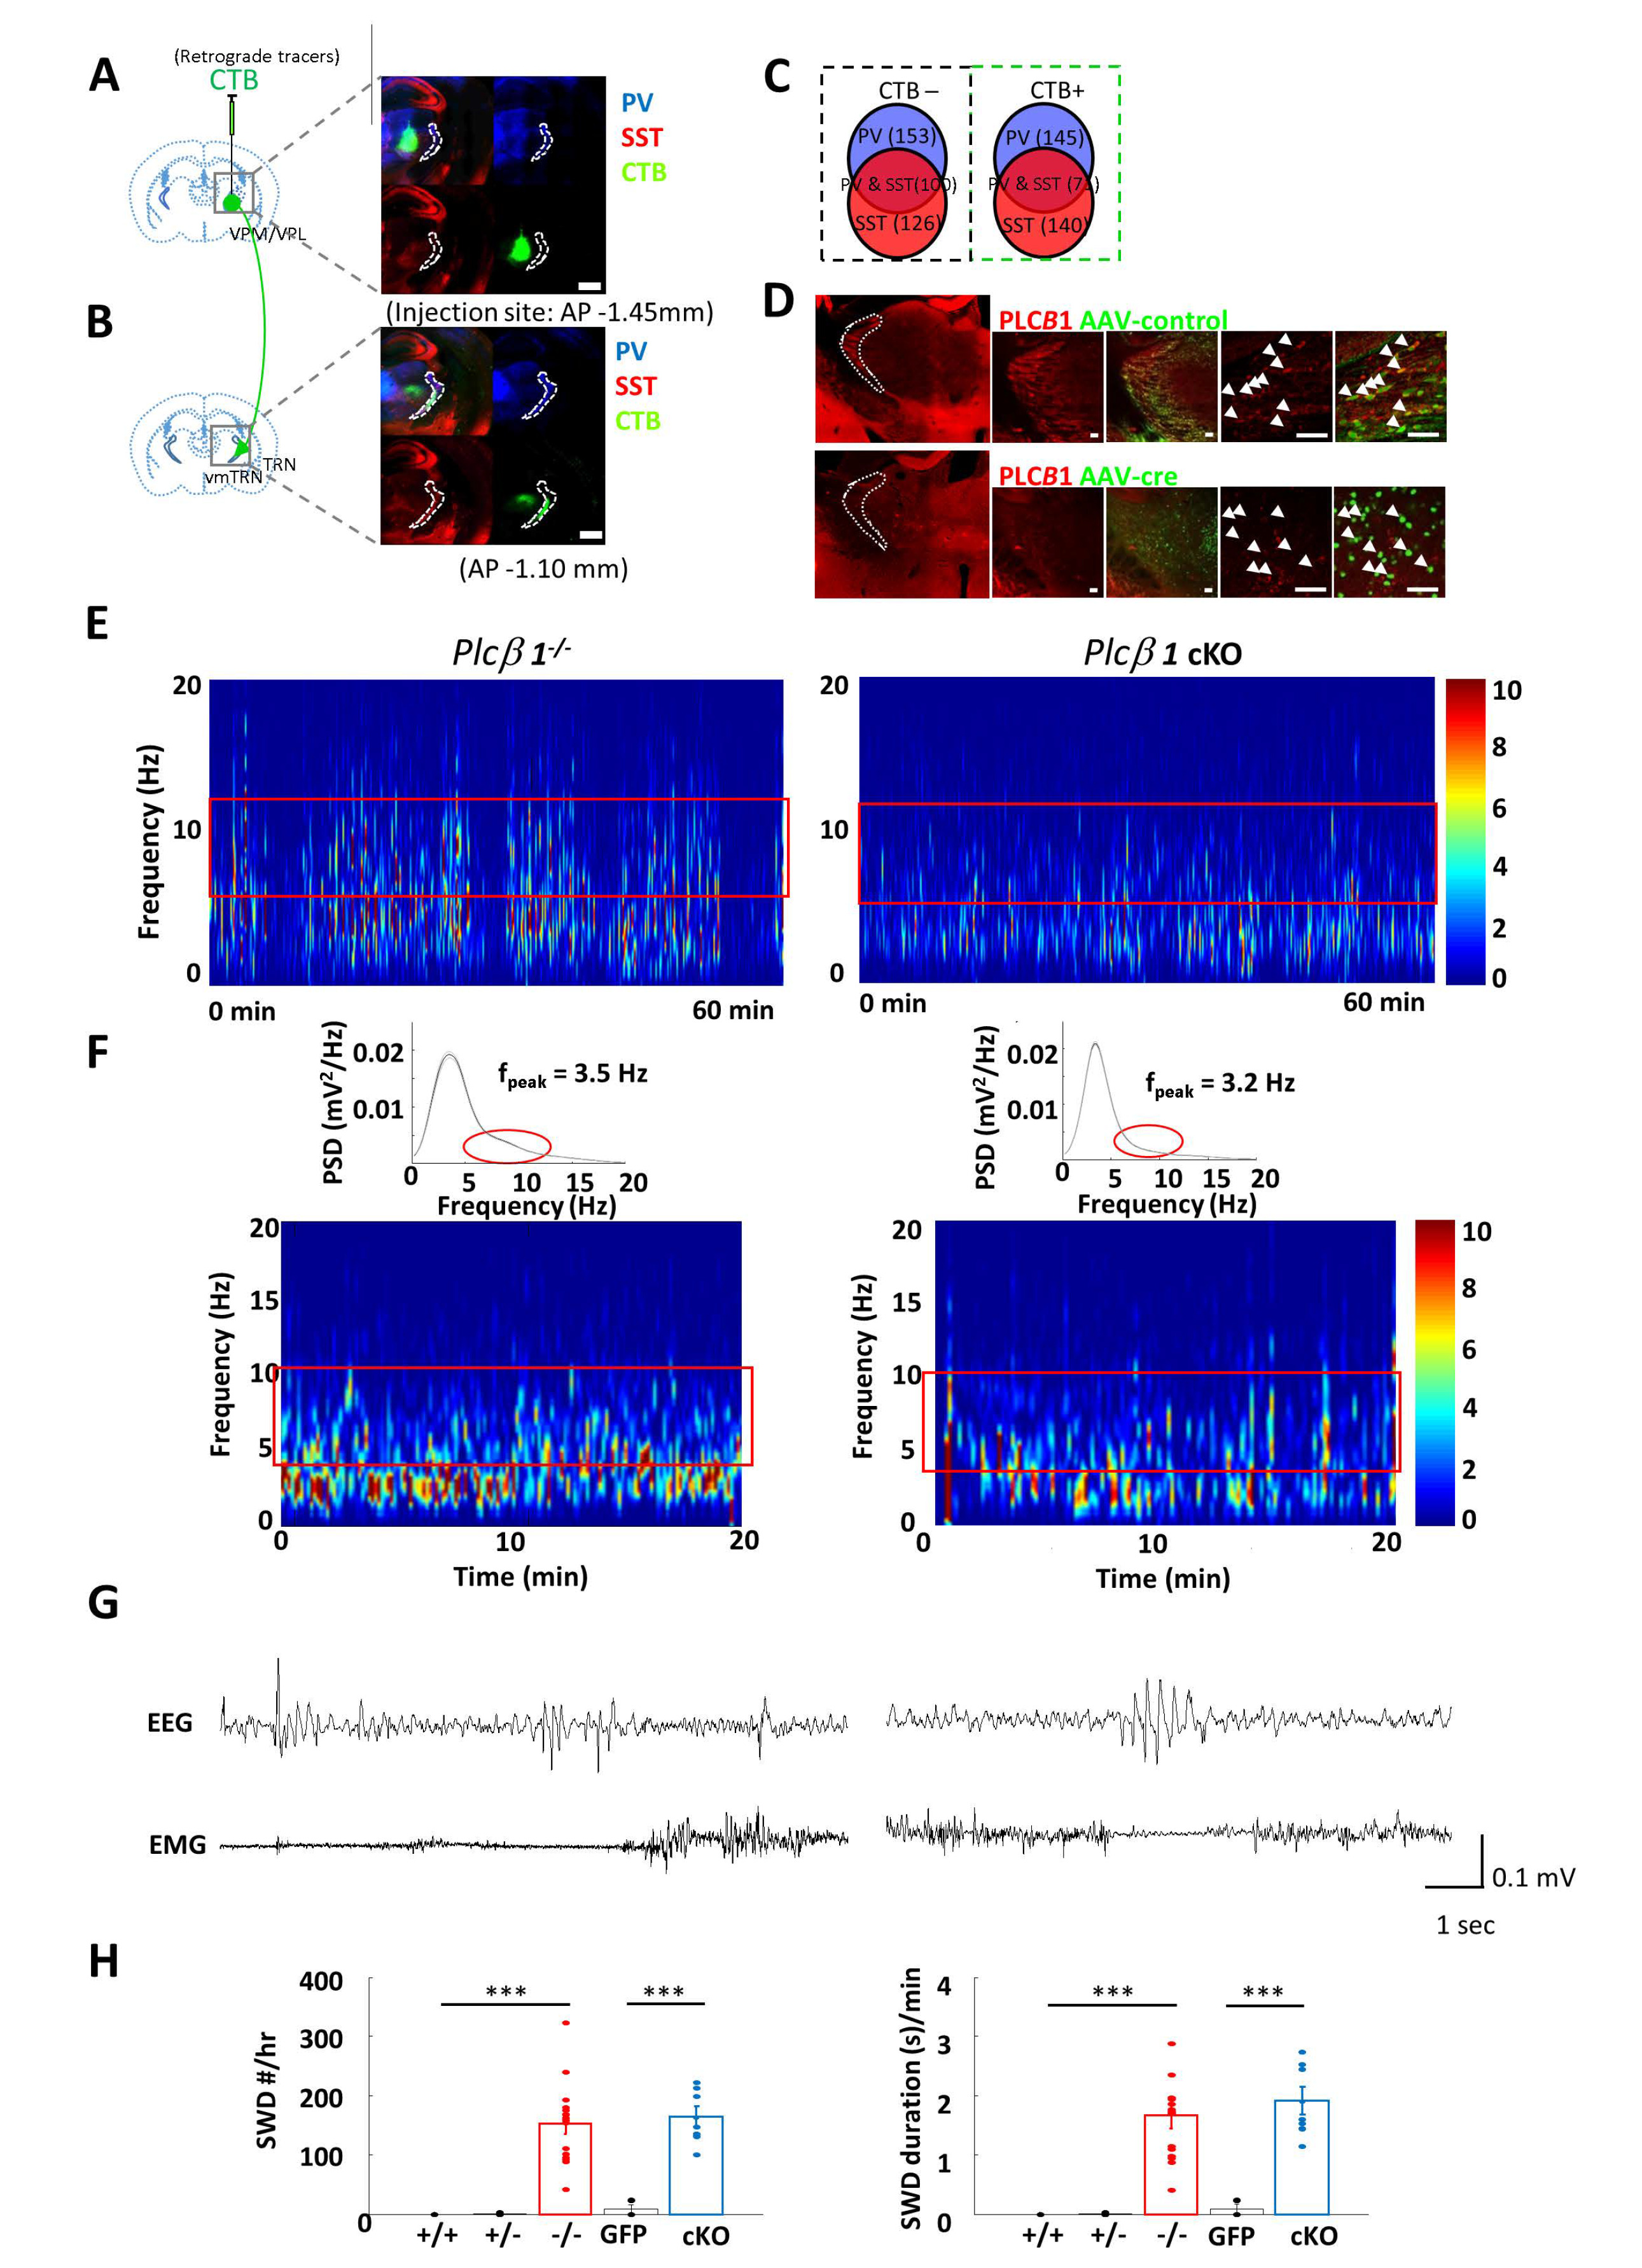
Fig. 2. Selective Plcβ1 deletion in the ventromedial (vm) TRN induces absence seizures. (A) Left, schematic depiction of CTB injection. Right, PV and SST immunostaining at the CTB injection site. The white boundary represents the anterior TRN. Scale bar, 50 µm. (B) Left, retrograde labeling of neurons projecting from the vmTRN to TC neurons. Right, PV and SST immunostaining of CTB signals in the vmTRN (inside white boundary). Scale bar, 50 µm. (C) Population of PV- and SST-expressing cells in vmTRN neurons. The left square represents CTB-negative neurons, and the right square represents CTB-positive neurons (D) The expression of PLCβ1 was not affected by the injection of AAV-control (GFP) into the vmTRN regions (upper). The expression of PLCβ1 was greatly reduced by the injection of AAV-syn-cre into the vmTRN regions of B6 Plcβ1 conditional knockout mice (cKO) (lower). Scale bar: 50 µm. (E) Average EEG power spectrogram of cKO mice. The red square indicates the 5~15 Hz frequency range. (F) Power analysis in spectrogram. Plcβ1-/- mice showed a peak frequency at 3.5 Hz, and Plcβ cKO mice showed a peak frequency at 3.2 Hz. The red block indicate the disappearance of the frequency range (5~12 Hz). (G) Representative EEG and EMG traces from Plcβ1-/- and cKO mice. (H) Summary graphs of the total numbers (left) and average durations (right) of SWDs in Plcβ1+/+ (n=8), +/- (n=10), -/-(n=12), GFP (n=9), and cKO (n=10) mice. The values in the Plcβ1+/+, Plcβ1+/- and GFP groups did not significantly differ from each other. The values in the Plcβ1-/- and cKO groups did not significantly differ from each other, while those in the Plcβ1-/- and cKO groups were significantly different from those in the Plcβ1+/+, Plcβ1+/- and GFP groups. The data are presented as the mean±SEM, one-way ANOVA, ***p<0.001, post hoc (Bonferroni).
© Exp Neurobiol