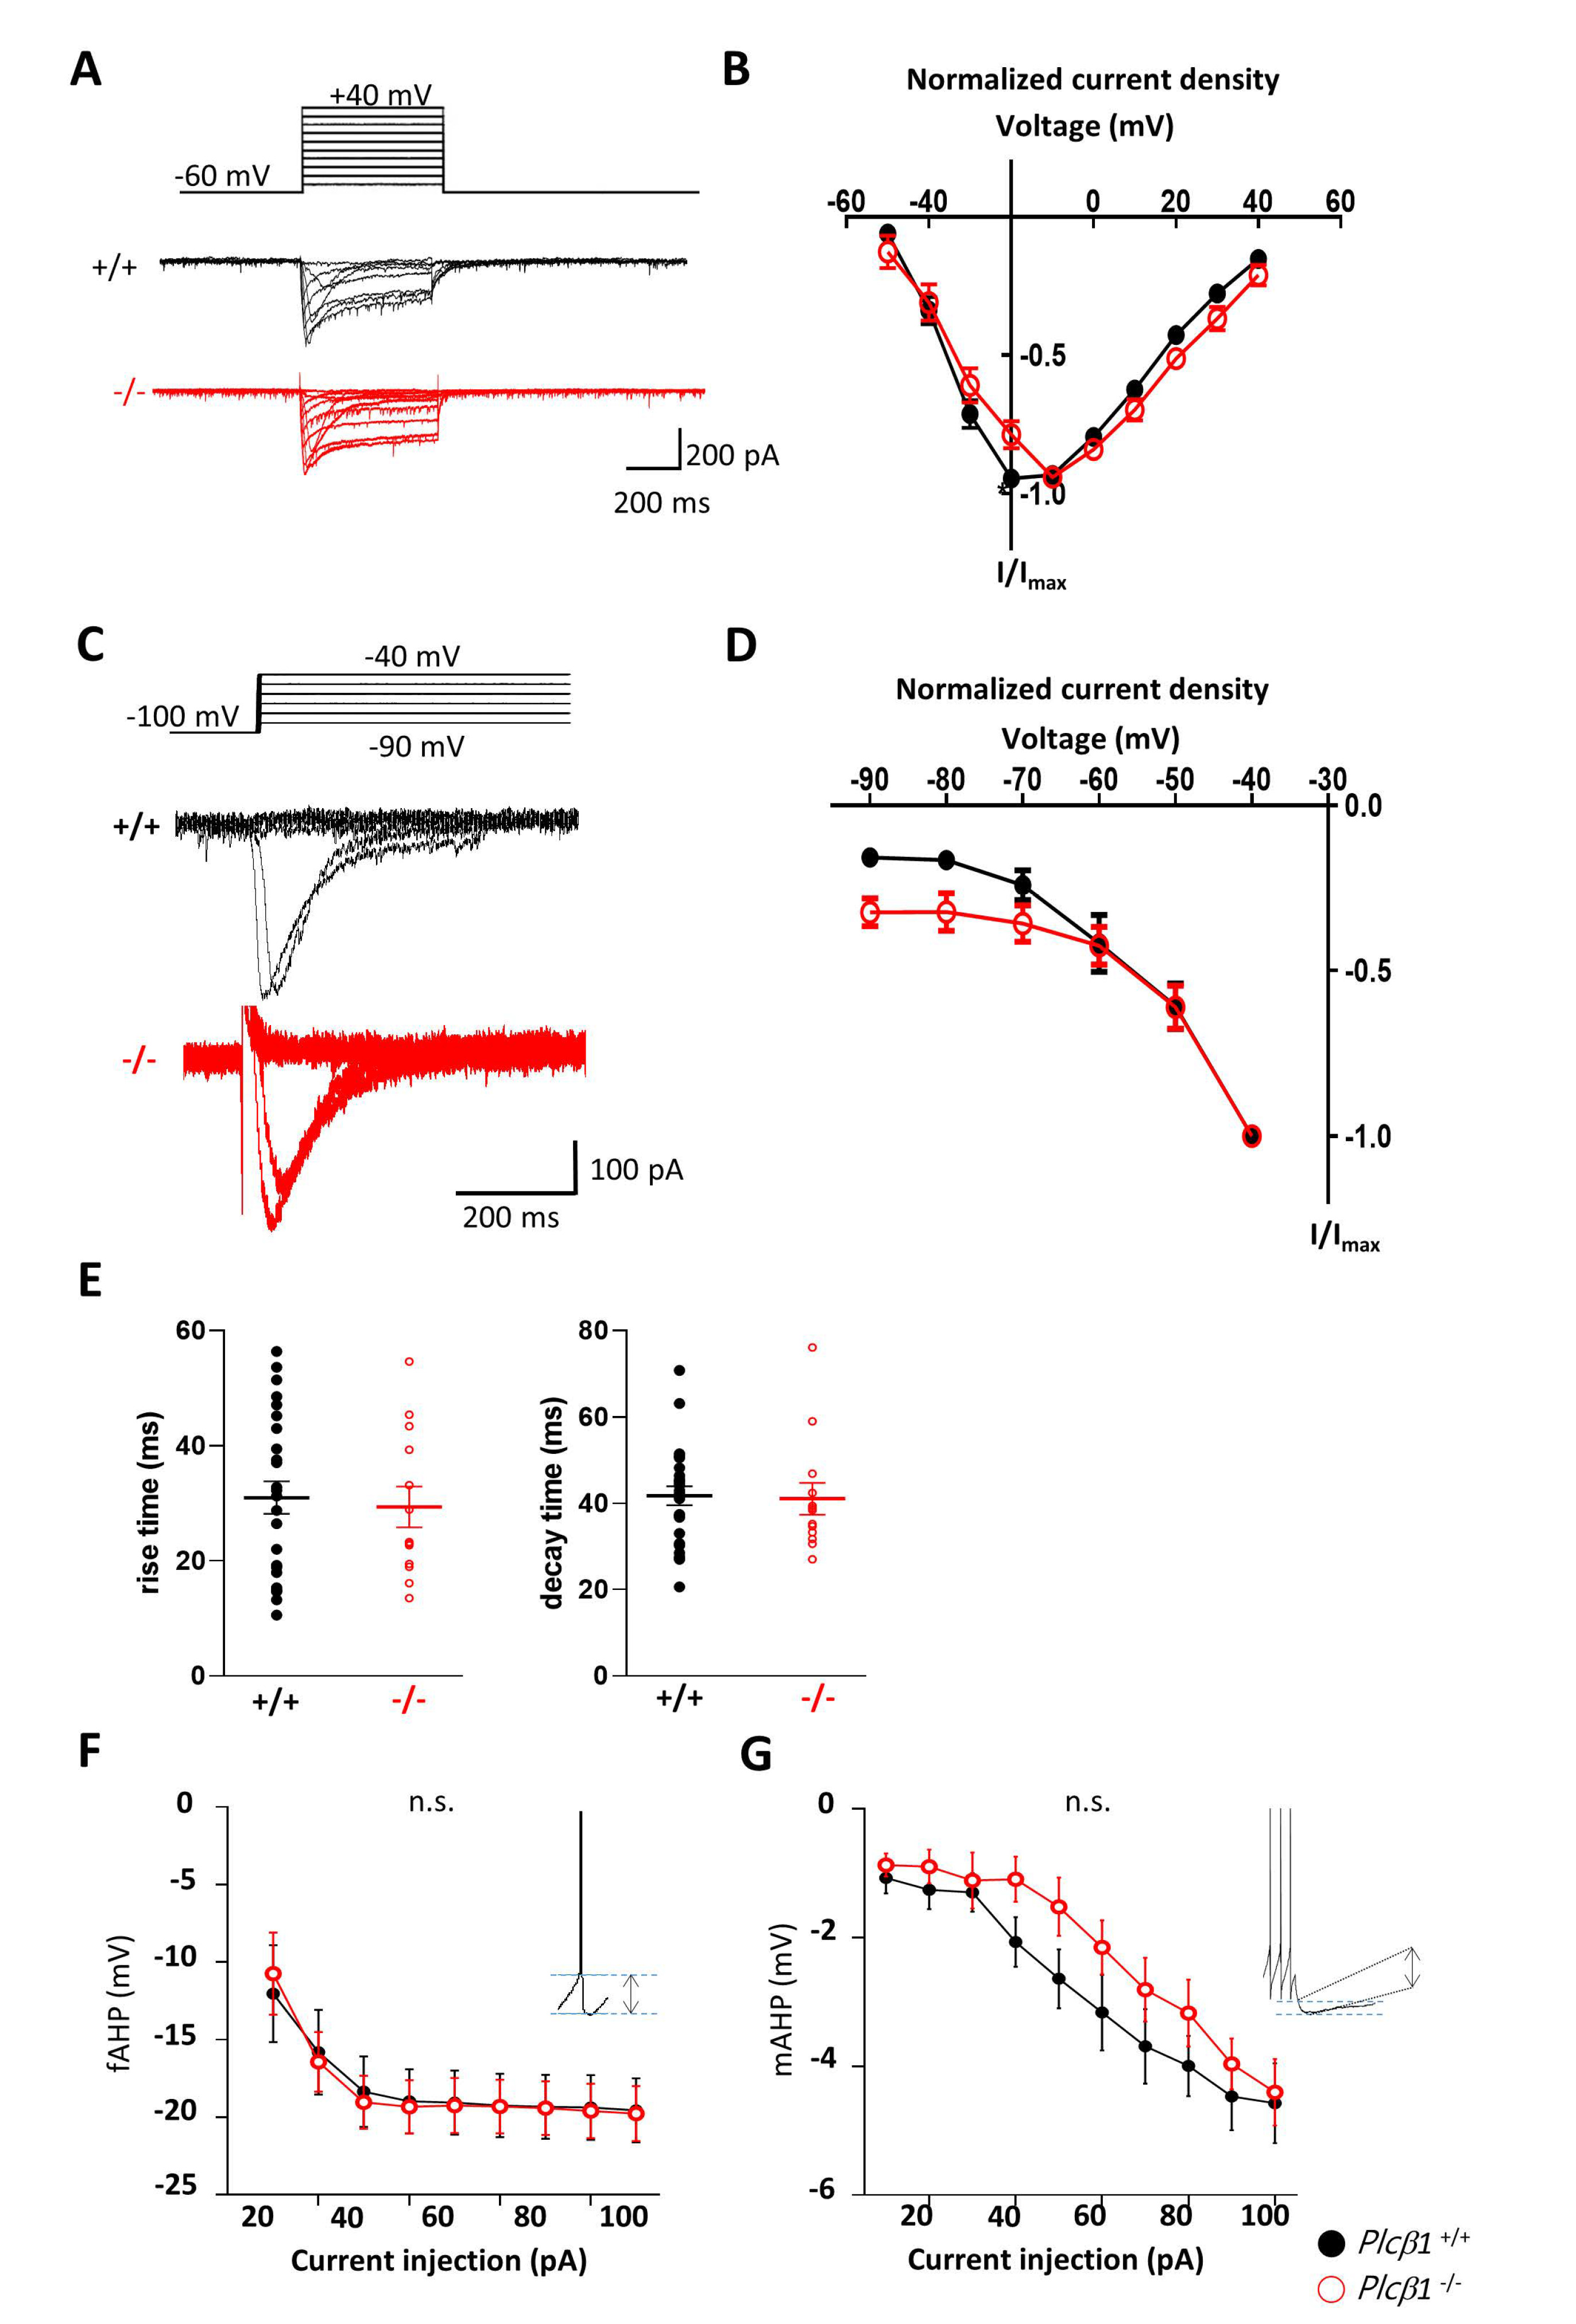
Fig. 6. Neither LVA nor HVA Ca2+ currents were changed in the vmTRNs of Plcβ1-/- mice. (A) Protocol for activating HVA Ca2+ channels (upper) and representative traces of HVA Ca2+ currents in Plcβ1+/+ (middle) and Plcβ1-/- (lower) vmTRN neurons. (B) Summary graph of the normalized HVA current density (+/+, n=16, 9 mice; -/-, n=16, 6 mice). Two-tailed t test, n.s. p>0.92. (C) Protocol for activating LVA Ca2+ channels (upper) and representative traces of LVA Ca2+ currents in Plcβ1+/+ (middle) and Plcβ1-/- (lower) vmTRN neurons. (D) Summary graph of the normalized LVA current density (+/+, n=31, 11 mice; -/-, n=17, 6 mice). Two-tailed t test, n.s. p>0.68. (E) LVA Ca2+ current rise time (left) and decay times (right) with in Plcβ1+/+ and Plcβ1-/- mice. (F) Average fAHPs and (G) average mAHPs in Plcβ1+/+ and Plcβ1-/- vmTRN neurons (+/+, n=30, 10 mice; -/-, n=15, 5 mice). Two-way ANOVA; multiple pairwise comparisons with a Bonferroni correction.
© Exp Neurobiol