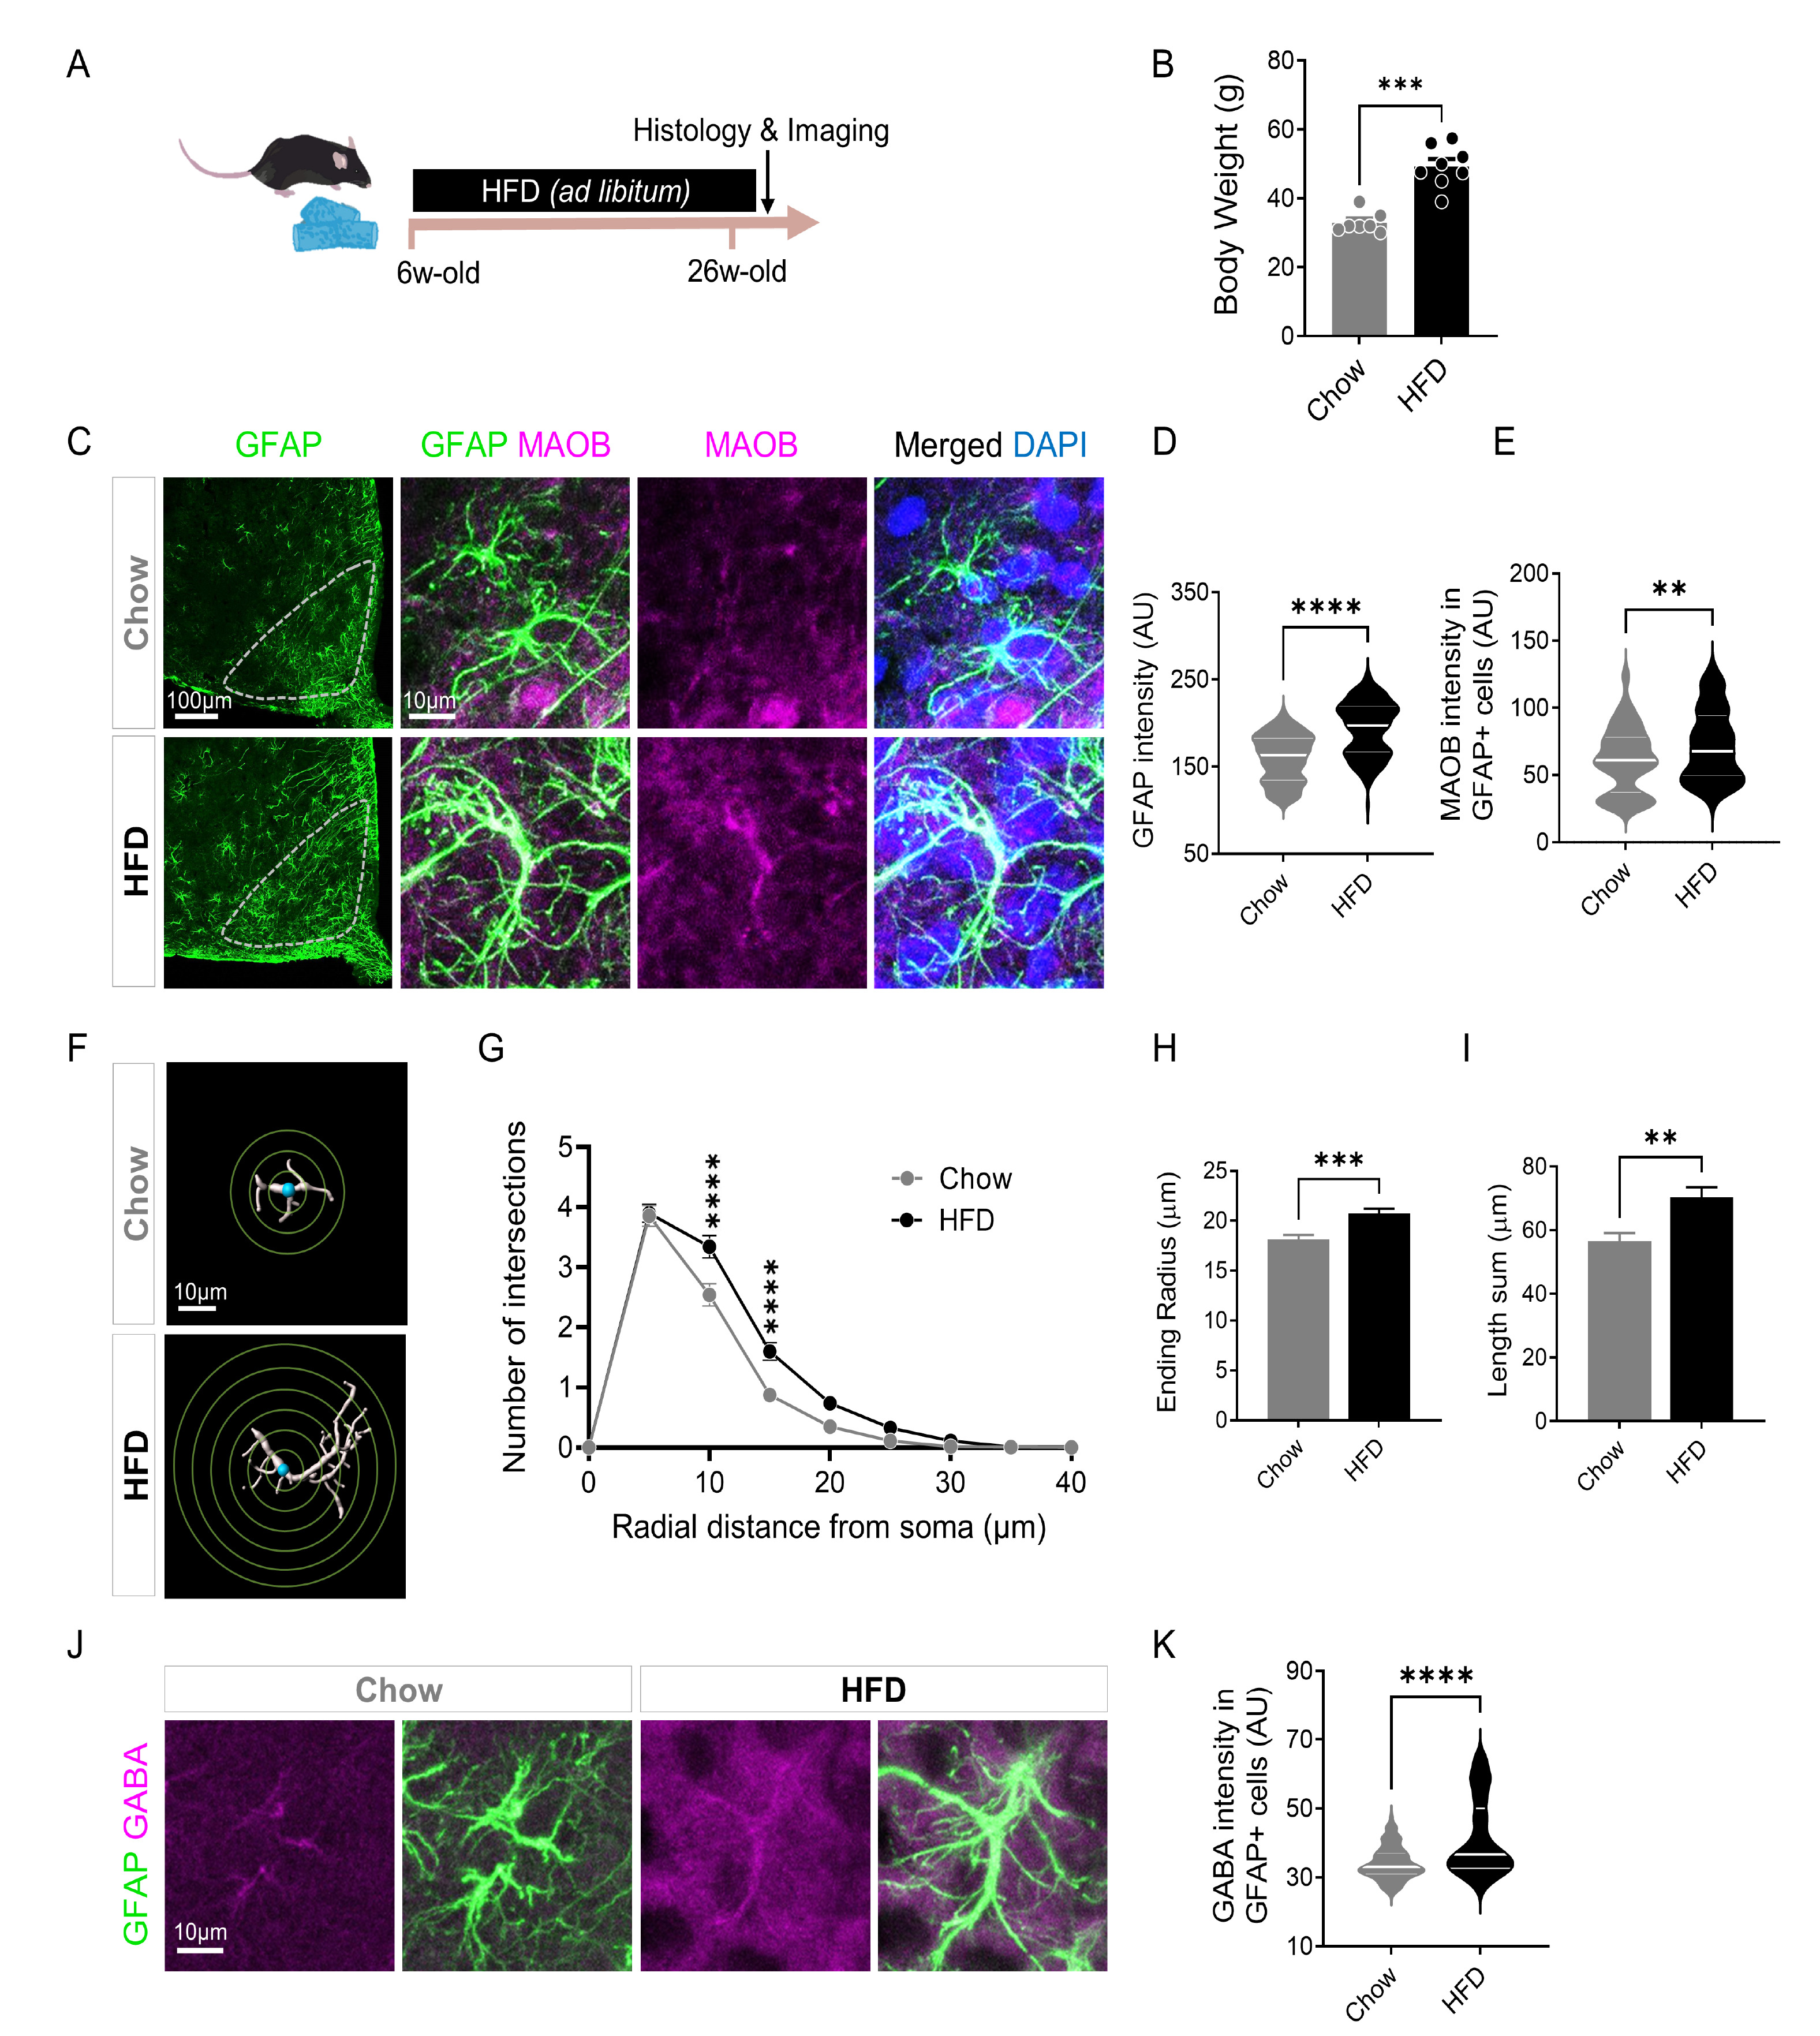
Fig. 1. Elevated MAOB and GABA in reactive astrocytes in the ARC after chronic HFD feeding. (A) Experimental timeline for high-fat diet (HFD)-induced obese mouse model. (B) Summarized bar graph showing the body weight (g) of chow diet (Chow) and HFD mice (Chow, n=7 mice; HFD, n=8 mice; Mann-Whitney test, p=0.0005). (C) Representative images of glial fibrillary acidic protein (GFAP) and monoamine oxidase B (MAOB) immunostaining in the arcuate nucleus (ARC) of Chow and HFD mice. (D) Quantification of GFAP intensity in Chow and HFD mice (Chow, n=122 cells from 3 mice; HFD, n=135 cells from 4 mice; Mann-Whitney test, p<0.0001). (E) Quantification of MAOB intensity in GFAP-positive (GFAP+) cells (Chow, n=116 cells from 3 mice; HFD, n=108 cells from 4 mice; Mann-Whitney test, p=0.0069). (F) Representative images of Sholl analysis in astrocytes of Chow and HFD mice. (G) Measurement of the number of intersections according to the radial distance (µm) from the soma via Sholl analysis (Chow, n=152 cells from 3 mice; HFD, n=194 cells from 4 mice; Ší’ák's multiple comparisons test, p<0.0001 at 10 and 15 µm). (H) Measurement of the ending radius in Chow and HFD mice (Chow, n=152 cells; HFD, n=194 cells; Mann-Whitney test, p=0.0004). (I) Measurement of the total length in Chow and HFD mice (Chow, n=147 cells from 3 mice; HFD, n=187 cells from 4 mice; Mann-Whitney test, p=0.0050). (J) Representative images of GFAP and GABA immunostaining in the ARC of Chow and HFD mice. (K) Quantification of GABA intensity in GFAP-positive (GFAP+) cells (Chow, n=106 cells from 3 mice; HFD, n=120 cells from 4 mice; Mann-Whitney test, p<0.0001). Data are presented as mean±SEM. Individual dots refer to animals. **p<0.01; ***p< 0.001; ****p<0.0001.
© Exp Neurobiol