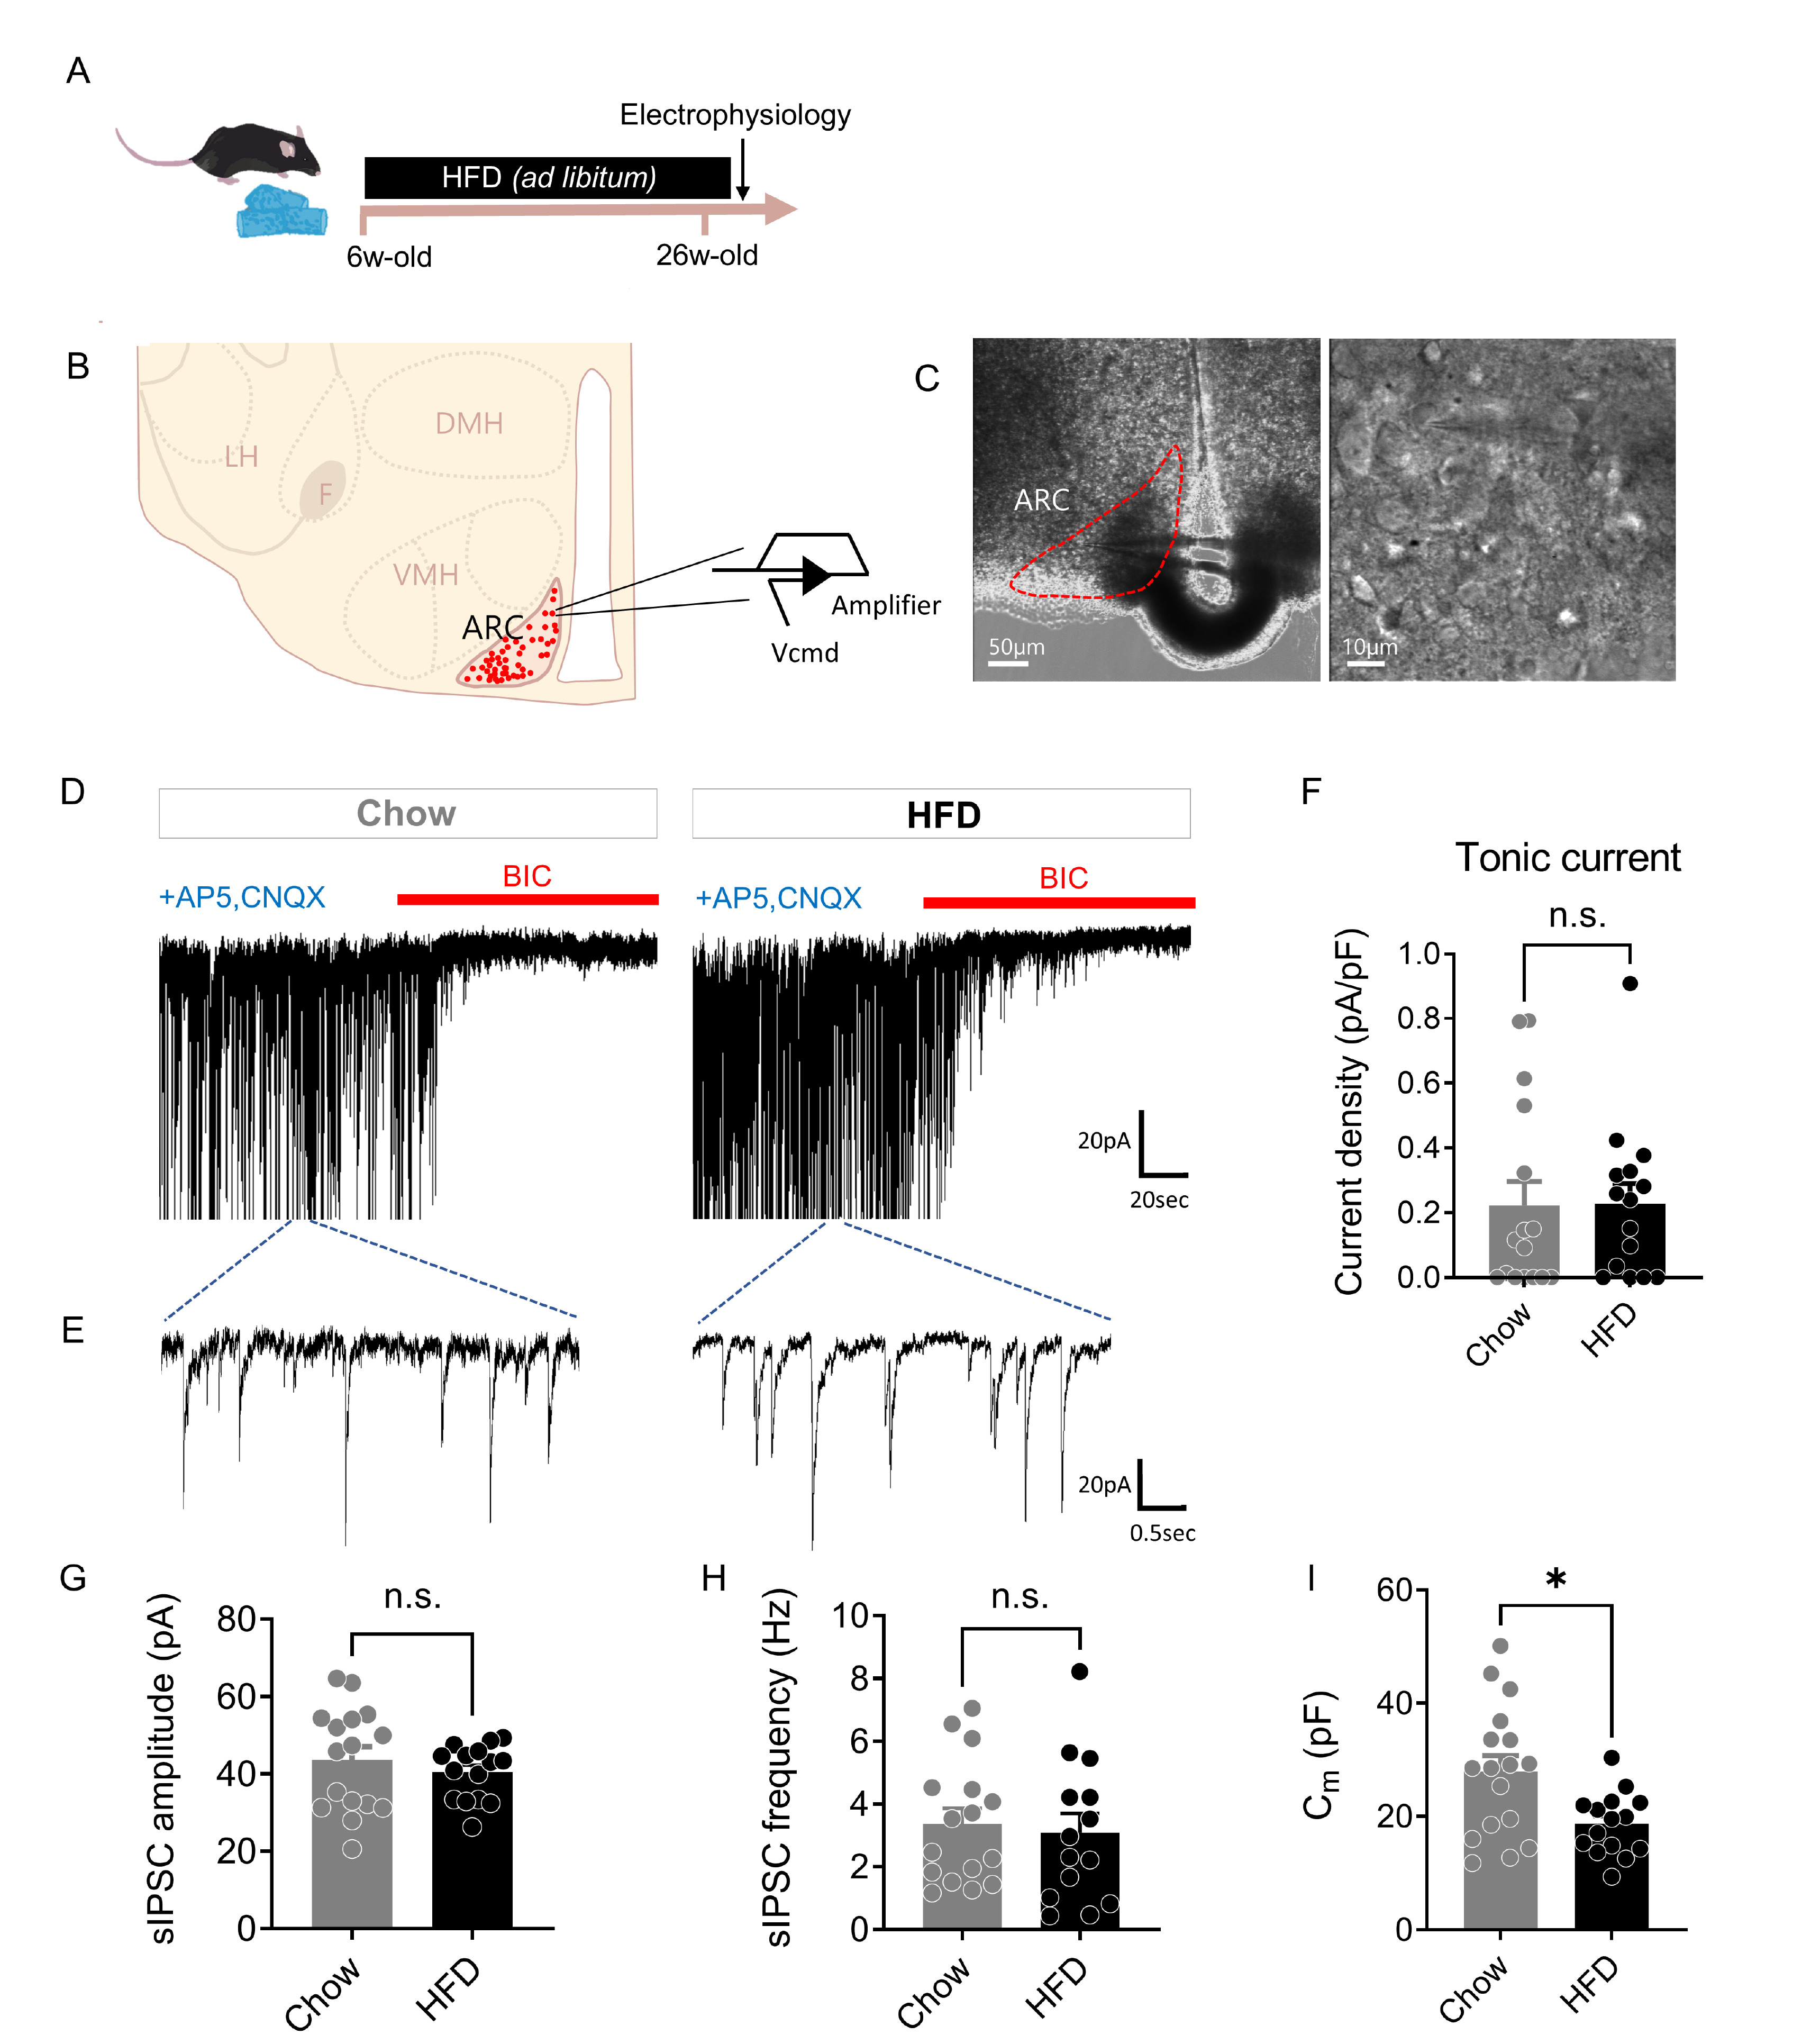
Fig. 2. Unaltered tonic inhibition in the ARC after chronic HFD feeding. (A) Experimental timeline for high-fat diet (HFD)-induced obese mouse model. (B) Schematic diagram of whole-cell patch-clamp recording in the ARC. (C) Representative infrared differential interference contrast (IR-DIC) images of whole-cell patch-clamp recording in the ARC. (D and E) Representative traces of GABAA receptor-mediated tonic GABA current (D) and spontaneous inhibitory post-synaptic current (sIPSC) (E) in Chow and HFD mice. (F) Summarized bar graph showing tonic GABA current density (pA/pF) in Chow and HFD mice (Chow, n=16 cells from 7 mice; HFD, n=15 cells from 7 mice; Mann-Whitney test, p=0.5851). (G) Summarized bar graph showing sIPSC amplitude (pA) in Chow and HFD mice (Chow, n=16 cells; HFD, n=15 cells; Mann-Whitney test, p=0.4173). (H) Summarized bar graph showing sIPSC frequency (Hz) in Chow and HFD mice (Chow, n=16 cells from 7 mice; HFD, n=14 cells from 7 mice; Mann-Whitney test, p=0.5449). (I) Summarized bar graph showing membrane capacitance (pF) in Chow and HFD mice (Chow, n=17 cells from 7 mice; HFD, n=15 cells from 7 mice; Mann-Whitney test, p=0.0238). Data are presented as mean ± SEM. *p<0.05.
© Exp Neurobiol