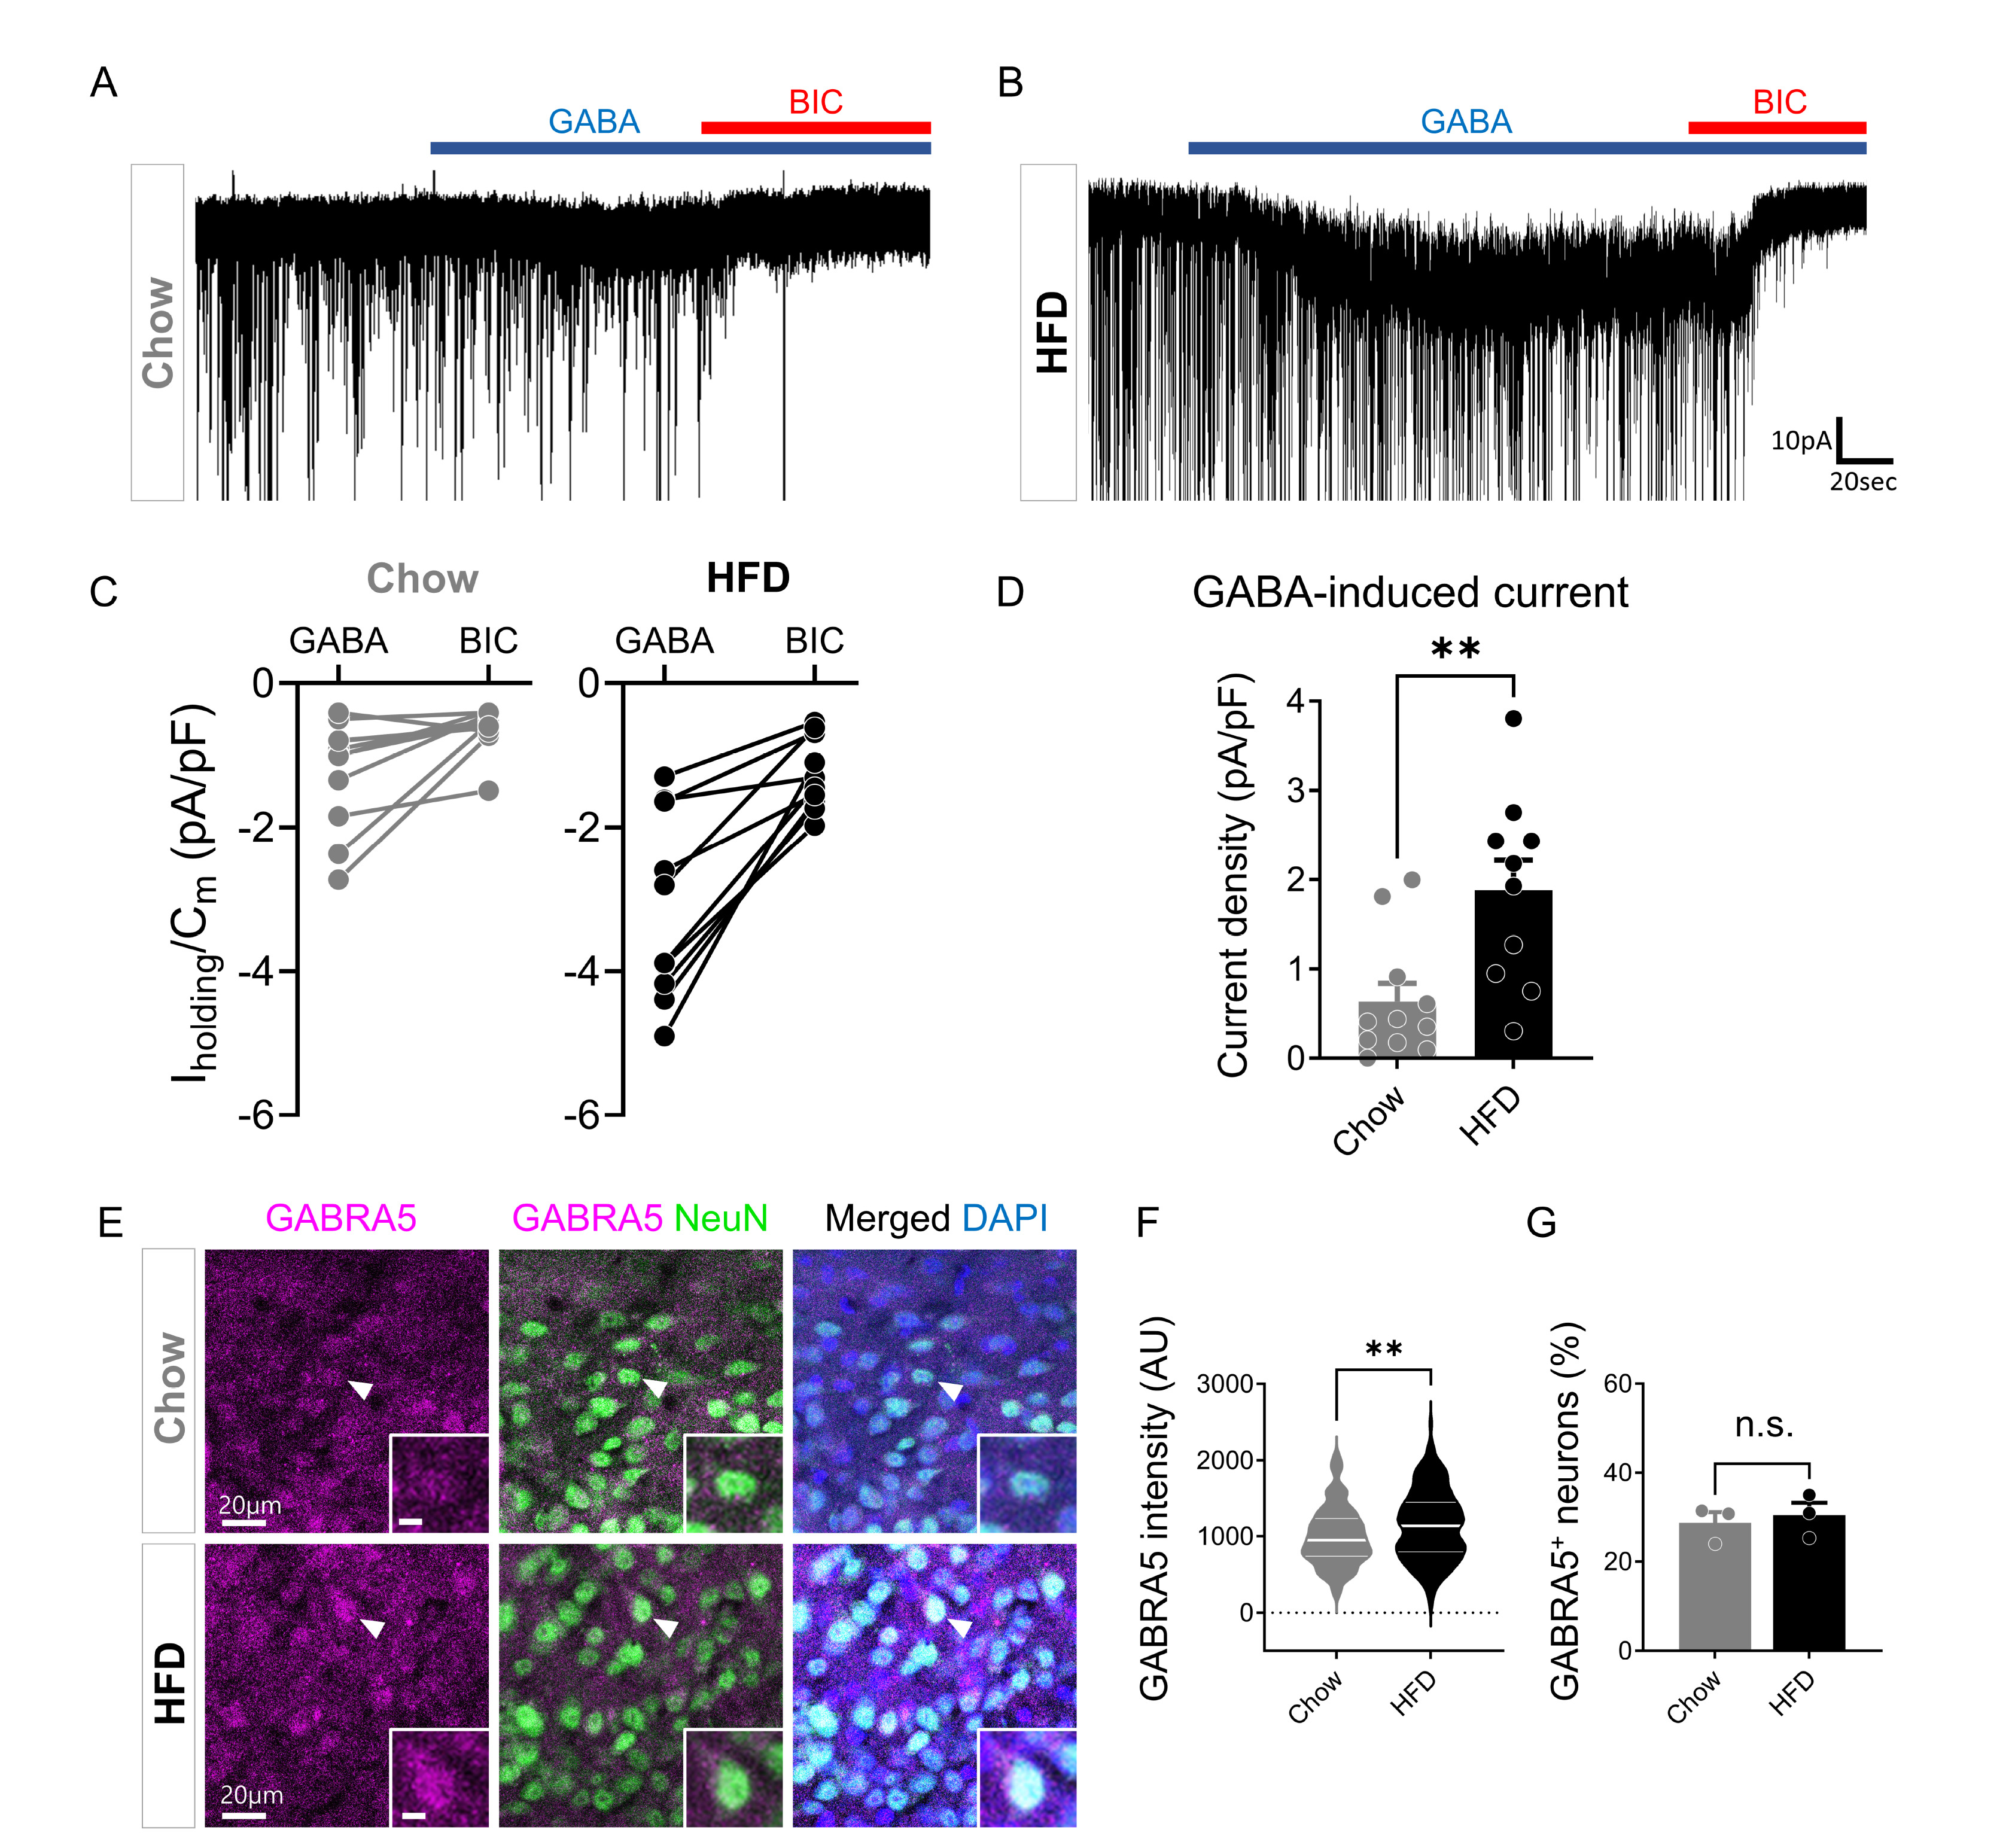
Fig. 3. Elevated extrasynaptic GABAA receptor in the ARC after chronic HFD feeding. (A and B) Representative traces of GABA-induced tonic current in Chow (A) and HFD (B) mice. (C) Paired plot showing Iholding/Cm (pA/pF) change in Chow and HFD mice (Chow, n=11 cells from 4 mice; HFD, n=10 cells from 4 mice). (D) Summarized bar graph showing GABA-induced tonic current density (pA/pF) in chow and HFD mice (Chow, n=11 cells; HFD, n=10 cells; Mann-Whitney test, p=0.0037). (E) Representative images of GABRA5 and NeuN immunostaining in the ARC of Chow and HFD mice (inset scale bar, 5 µm). (F) Quantification of GABRA5 intensity in Chow and HFD mice (Chow, n=129 cells from 3 mice; HFD, n=208 cells from 3 mice; Mann-Whitney test, p=0.0029). (G) Percentages of GABRA5-positive neurons in Chow and HFD mice (Chow, n=3 slices from 3 mice; HFD, 3 slices from 3 mice; Mann-Whitney test, p=0.7). Data are presented as mean ± SEM. **p<0.01.
© Exp Neurobiol