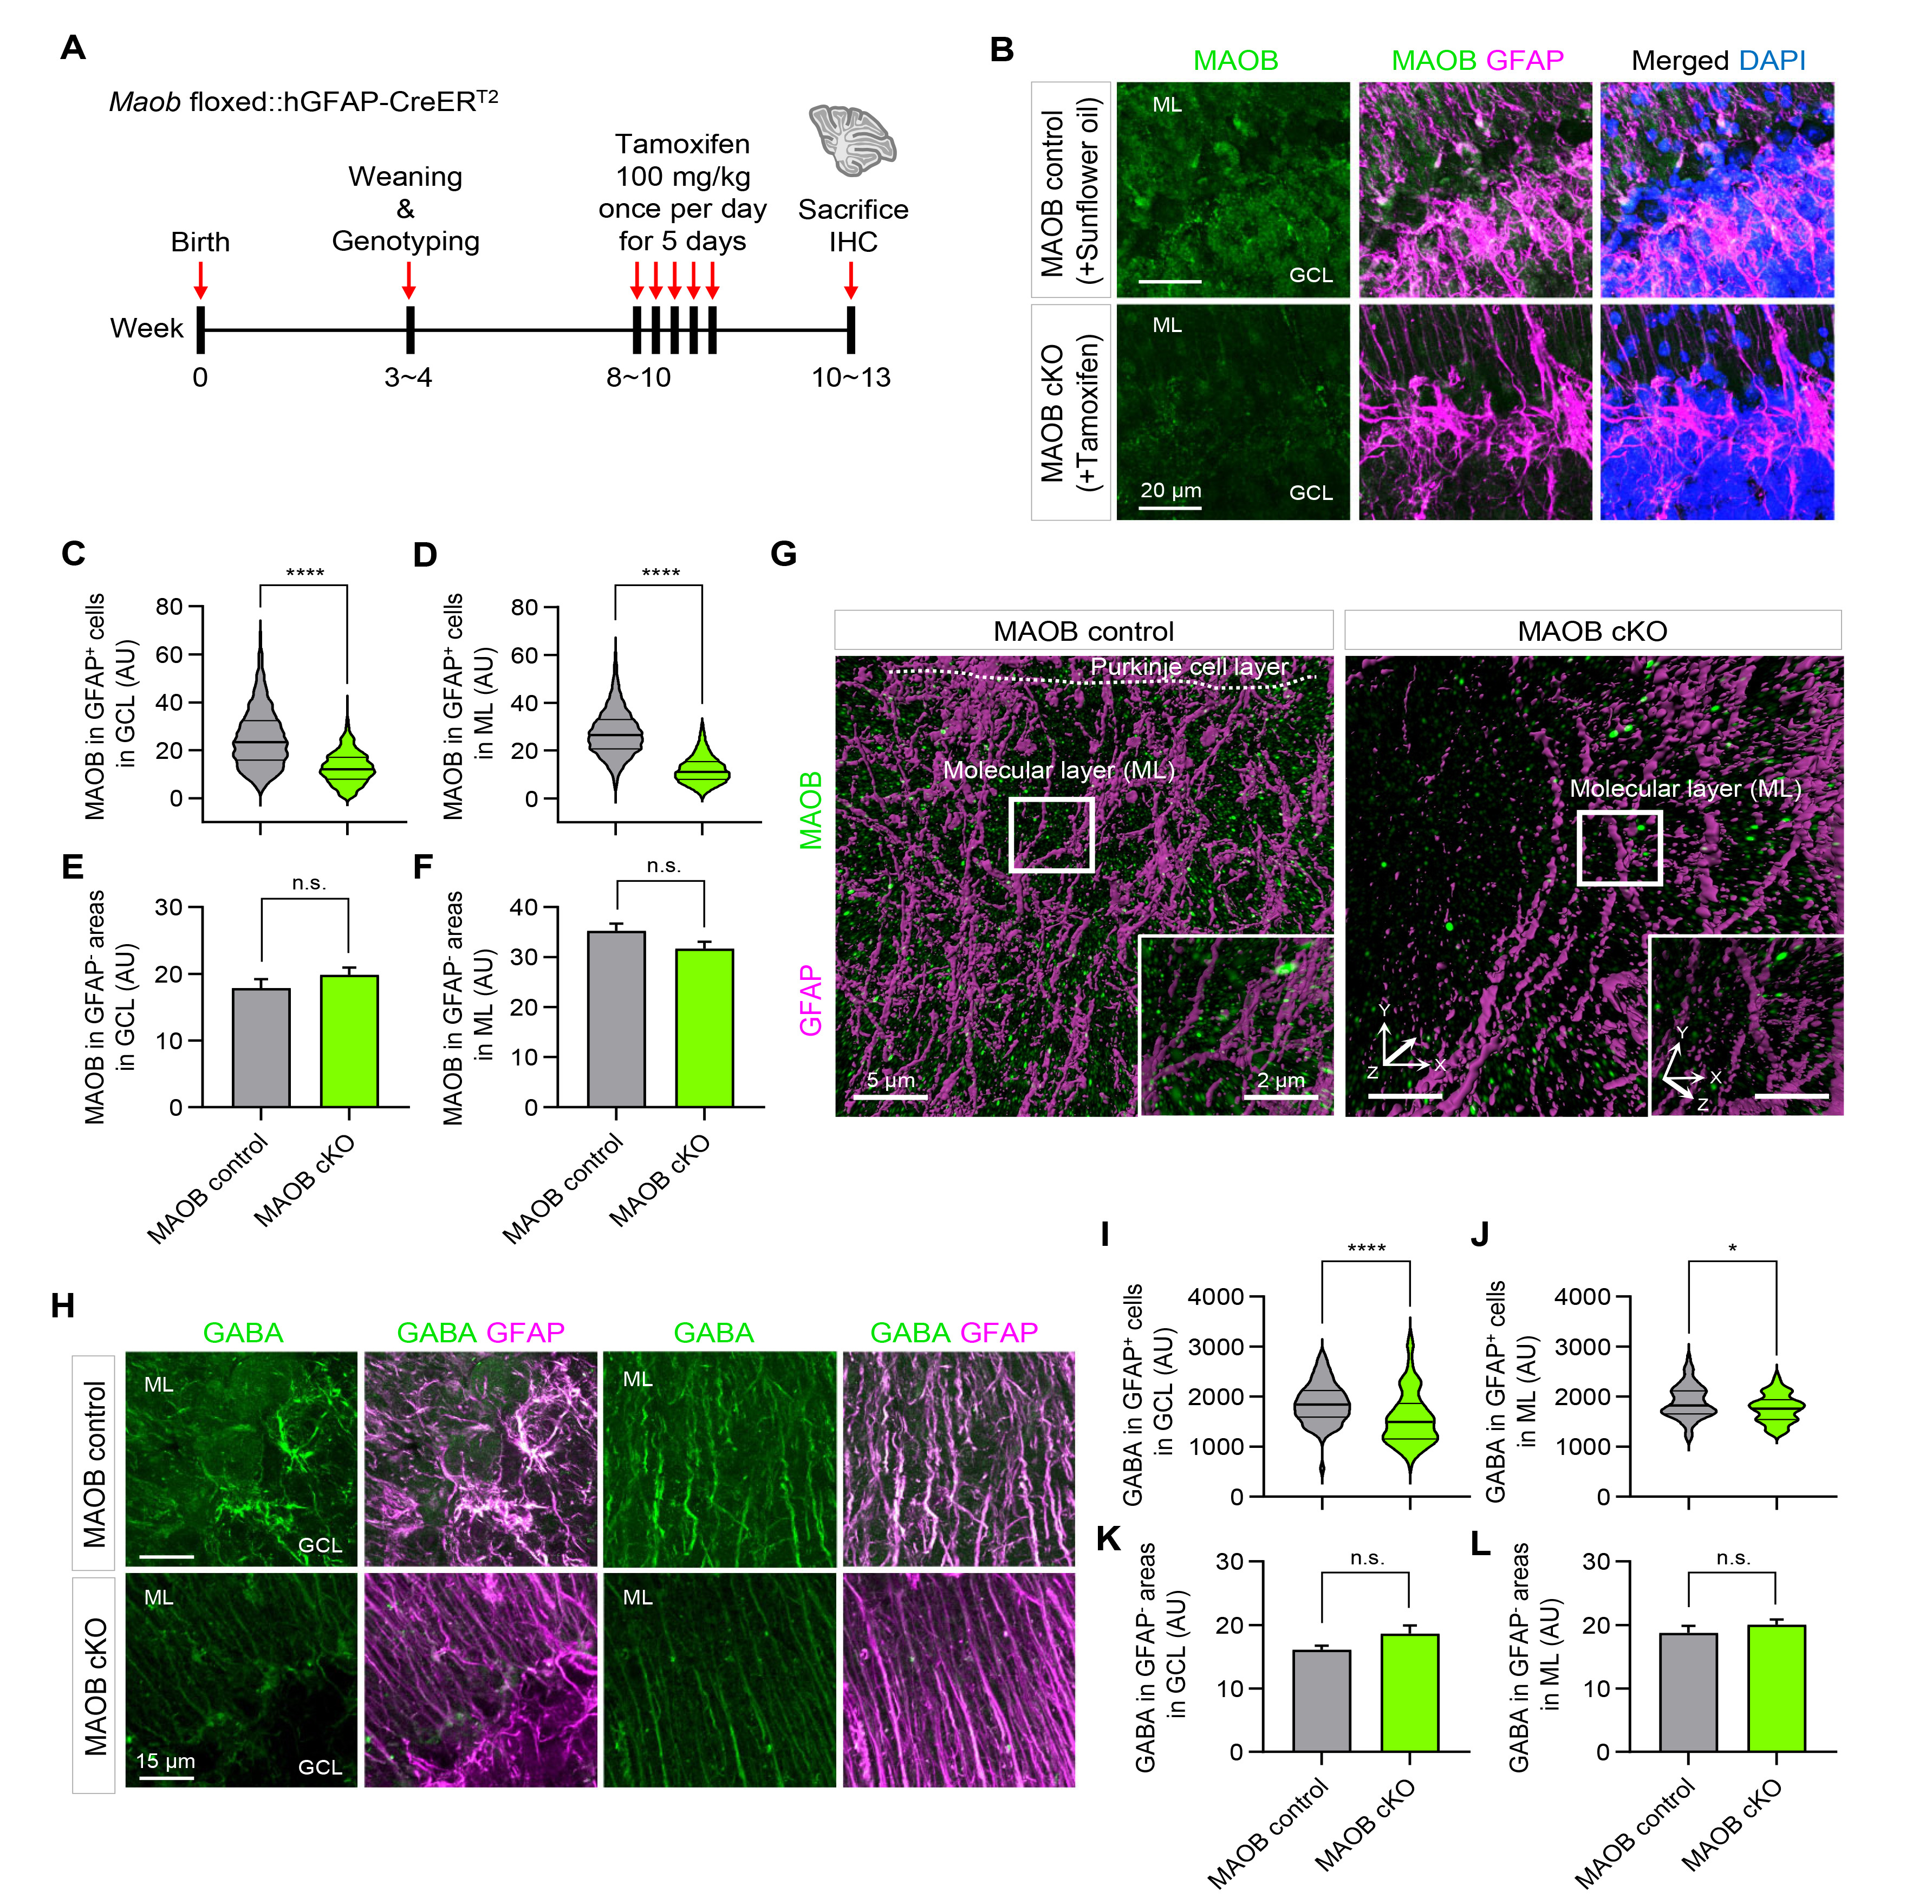
Fig. 2. MAOB and GABA levels in the cerebellum are reduced in astrocyte-specific MAOB cKO mice. (A) Experimental scheme and timeline using Maob floxed::hGFAP-CreERT2 mice. (B) Representative confocal images of MAOB (green), GFAP (magenta) and DAPI (blue) fluorescence in sagittal slices of the cerebellum in sunflower oil-injected MAOB control and tamoxifen-injected MAOB cKO mice. ML, molecular layer; GCL, granule cell layer. (C, D) Quantification of MAOB intensity in GFAP-positive cells in the GCL (C; MAOB control, 2186 voxels; MAOB cKO, 695 voxels; Mann-Whitney test, p<0.0001) and in the ML (D; MAOB control, 3455 voxels; MAOB cKO, 9916 voxels; Mann-Whitney test, p<0.0001). (E, F) Quantification of MAOB intensity in GFAP-negative areas in the GCL (E; MAOB control, 27 pixels; MAOB cKO, 22 pixels; Mann-Whitney test, p=0.8034) and in the ML (F; MAOB control, 22 pixels; MAOB cKO, 19 pixels; Mann-Whitney test, p=0.1084). (G) Representative SIM images of MAOB (green) and GFAP (magenta) in sagittal slices of cerebellum in MAOB control (left) and astrocytic MAOB cKO mice (right). White boxes, magnified regions. Insets, magnified and rotated 3-dimensional (3D) images. (H) Representative images for GABA (green) and GFAP (magenta) in sagittal slices of cerebellum in MAOB control and astrocytic MAOB cKO mice. (I, J) Quantification of GABA intensity in GFAP-positive cells in the GCL (I; MAOB control, 73 voxels; MAOB cKO, 84 voxels; Mann-Whitney test, p<0.0001) and in the ML (J; MAOB control, 68 voxels; MAOB cKO, 63 voxels; Unpaired t test, p<0.05). (K, L) Quantification of GABA intensity in GFAP-negative areas in the GCL (K; MAOB control, 20 pixels; MAOB cKO, 22 pixels; Mann-Whitney test, p=0.1508) and in the ML (L; MAOB control, 26 pixels; MAOB cKO, 33 pixels; Mann-Whitney test, p=0.5119). In violin plots, the center line denotes the median value, while upper and lower lines denote the first quartile and third quartile, respectively. Data are presented as mean±SEM. ****p<0.0001; *p<0.05; n.s., not significant.
© Exp Neurobiol