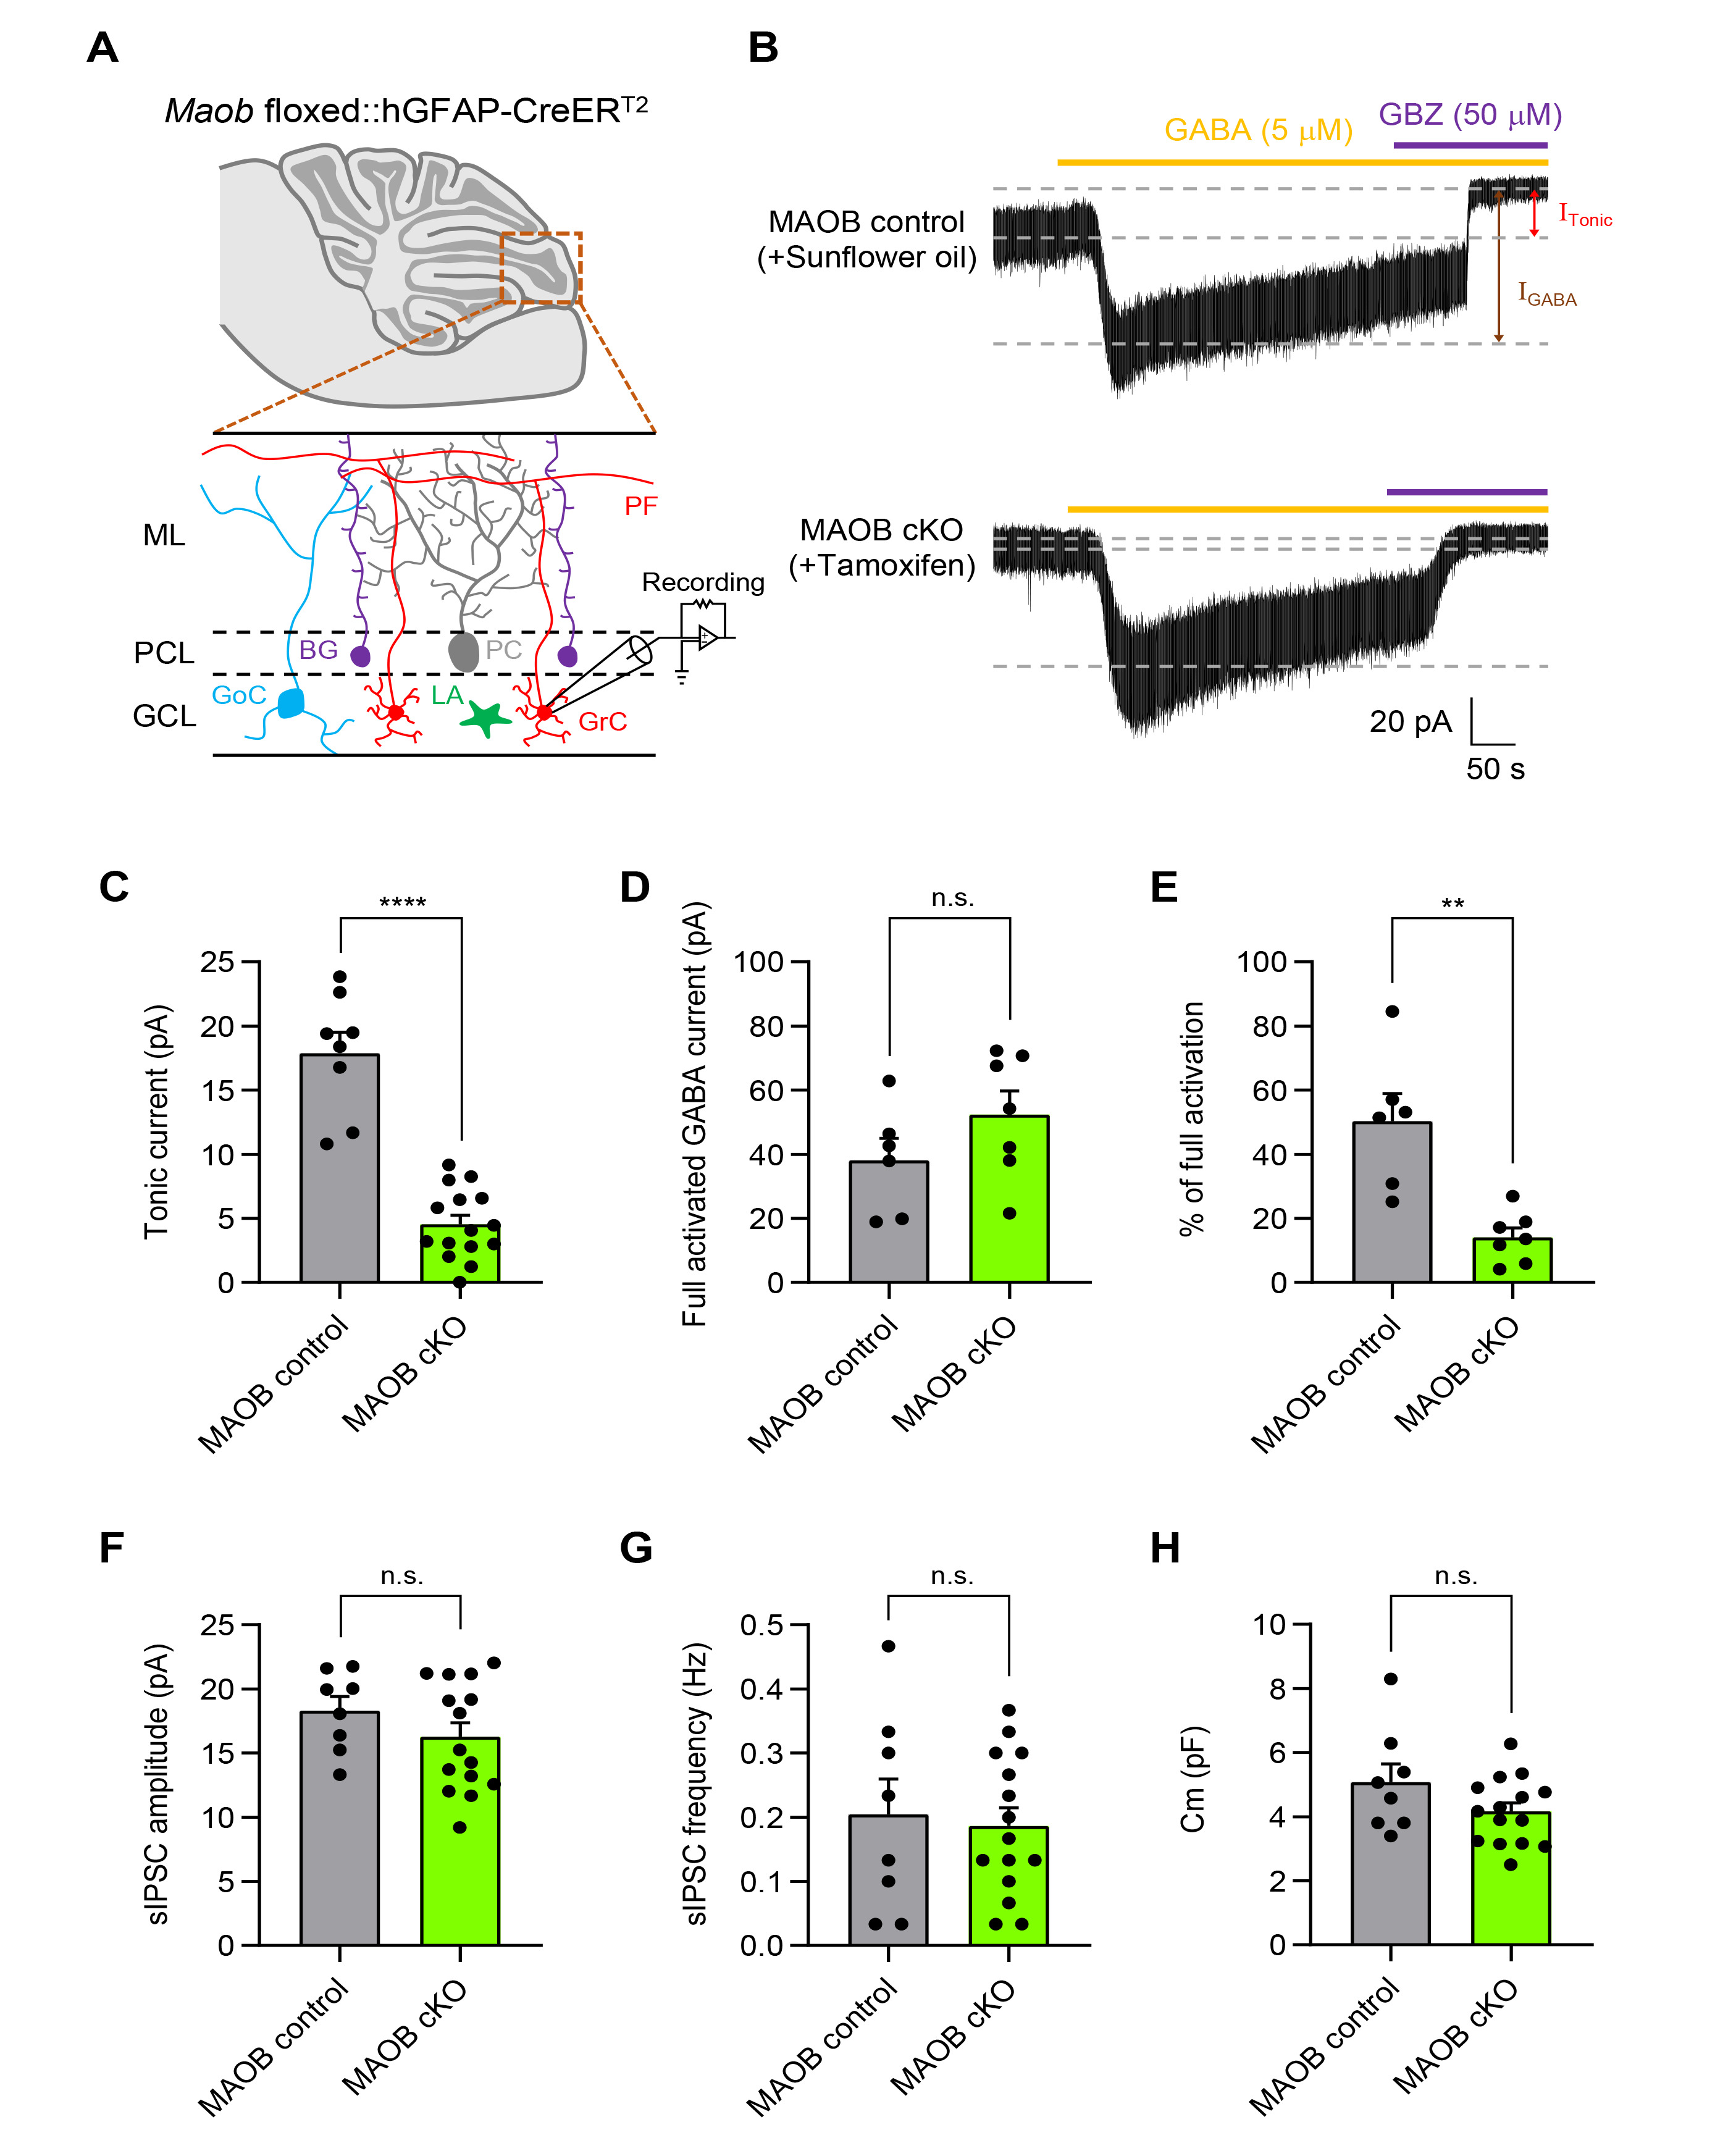
Fig. 3. Astrocyte-specific MAOB cKO mice show a significant reduction in tonic GABA inhibition in the cerebellum. (A) Schematic diagram of a cerebellar slice from Maob floxed::hGFAP-creERT2 mice (top) and magnified image of a whole-cell patch-clamped region in the cerebellar layers (bottom). GCL, Granule cell layer; PCL, Purkinje cell layer; ML, Molecular layer; Grc, Granule cell; GoC, Golgi cell; PC, Purkinje cell; BG, Bergmann glia; LA, Lamellar astrocyte; PF, Parallel fiber. (B) Representative tonic current traces from sunflower oil-injected MAOB control mice (top) and tamoxifen-injected MAOB cKO mice (bottom). Full activated GABA current (IGABA, brown arrow) and ambient GABA current (ITonic, red arrow) were measured by serial application of GABA 5 µM (orange dash) and GBZ 50 µM (purple dash). (C) Summarized scatter bar graphs of tonic current from MAOB control mice and astrocytic MAOB cKO mice (MAOB control, n=8; MAOB cKO, n=15; Unpaired t test, p<0.0001). (D) Summarized scatter bar graphs of full activated GABA current (MAOB control, n=6; MAOB cKO, n=7; Mann-Whitney test, p=0.1807). (E) Summarized scatter bar graphs of percentage of full activation (ITonic/IGABA) (MAOB control, n=6; MAOB cKO, n=7; Mann-Whitney test, p=0.0023). (F) Summarized scatter bar graphs of sIPSC amplitude (MAOB control, n=8; MAOB cKO, n=15; Unpaired t test, p=0.2423). (G) Summarized scatter bar graphs of sIPSC frequency (MAOB control, n=8; MAOB cKO, n=15; Unpaired t test, p=0.7551). (H) Summarized scatter bar graphs of cell membrane capacitance (Cm) (MAOB control, n=8; MAOB cKO, n=15; Unpaired t test, p=0.1125). Data are presented as mean±SEM. ****p<0.0001; **p<0.01; n.s., not significant.
© Exp Neurobiol