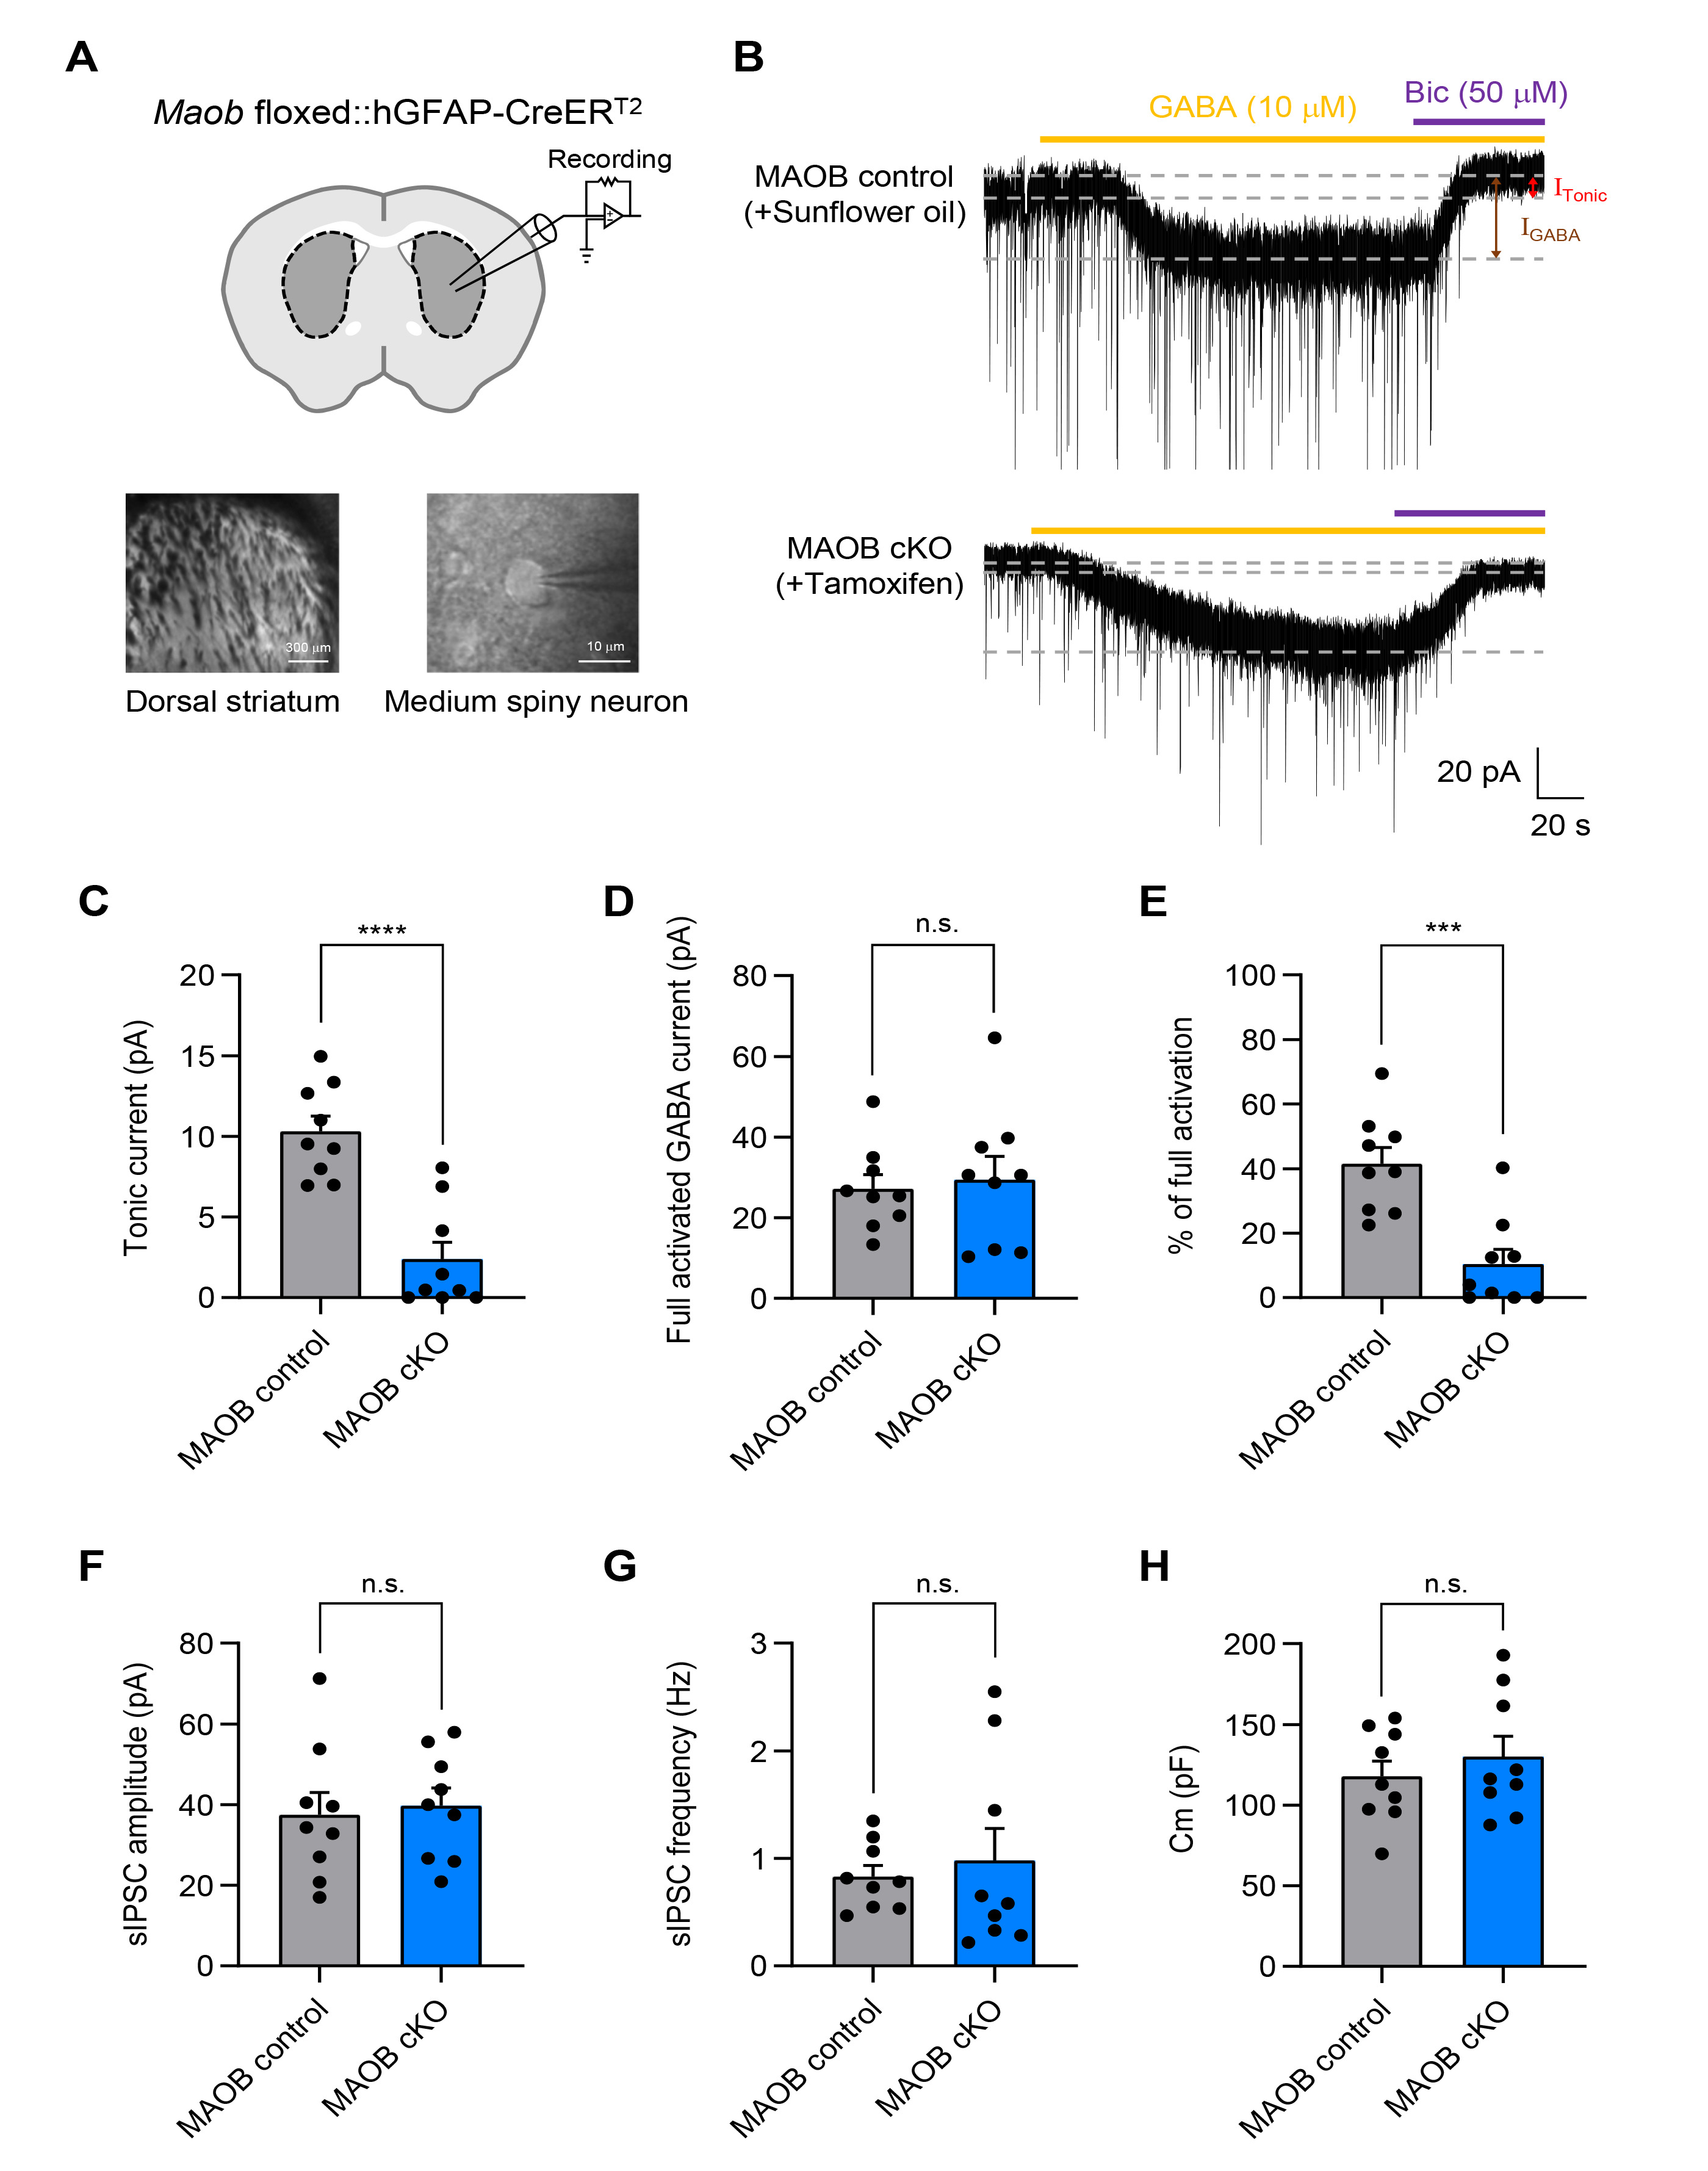
Fig. 5. Astrocyte-specific MAOB cKO mice show a significant reduction in tonic GABA inhibition in the striatum. (A) Schematic diagram of a striatal slice from Maob floxed::hGFAP-creERT2 mice (top) and magnified differential interference contrast (DIC) image of a whole-cell patch-clamped region in the dorsal striatum and medium spiny neurons (bottom). (B) Representative tonic current traces from sunflower oil-injected MAOB control mice (top) and tamoxifen-injected MAOB cKO mice (bottom). Full activated GABA current (IGABA, brown arrow) and ambient GABA current (ITonic, red arrow) were measured by serial application of GABA 10 µM (orange dash) and Bic 50 µM (purple dash). (C) Summarized scatter bar graphs of tonic current from MAOB control mice and astrocytic MAOB cKO mice (MAOB control, n=9; MAOB cKO, n=9; Unpaired t test, p<0.0001). (D) Summarized scatter bar graphs of full activated GABA current (MAOB control, n=9; MAOB cKO, n=9; Unpaired t test, p=0.7359). (E) Summarized scatter bar graphs of percentage of full activation (ITonic/IGABA) (MAOB control, n=9; MAOB cKO, n=9; Mann-Whitney test, p=0.0008). (F) Summarized scatter bar graphs of sIPSC amplitude (MAOB control, n=9; MAOB cKO, n=9; Unpaired t test, p=0.7534). (G) Summarized scatter bar graphs of sIPSC frequency (MAOB control, n=9; MAOB cKO, n=9; Welch’s test, p=0.6530). (H) Summarized scatter bar graphs of cell membrane capacitance (Cm) (MAOB control, n=9; MAOB cKO, n=9; Unpaired t test, p=0.4500). Data are presented as mean±SEM. ****p<0.0001; ***p<0.001; n.s., not significant.
© Exp Neurobiol