Download original image
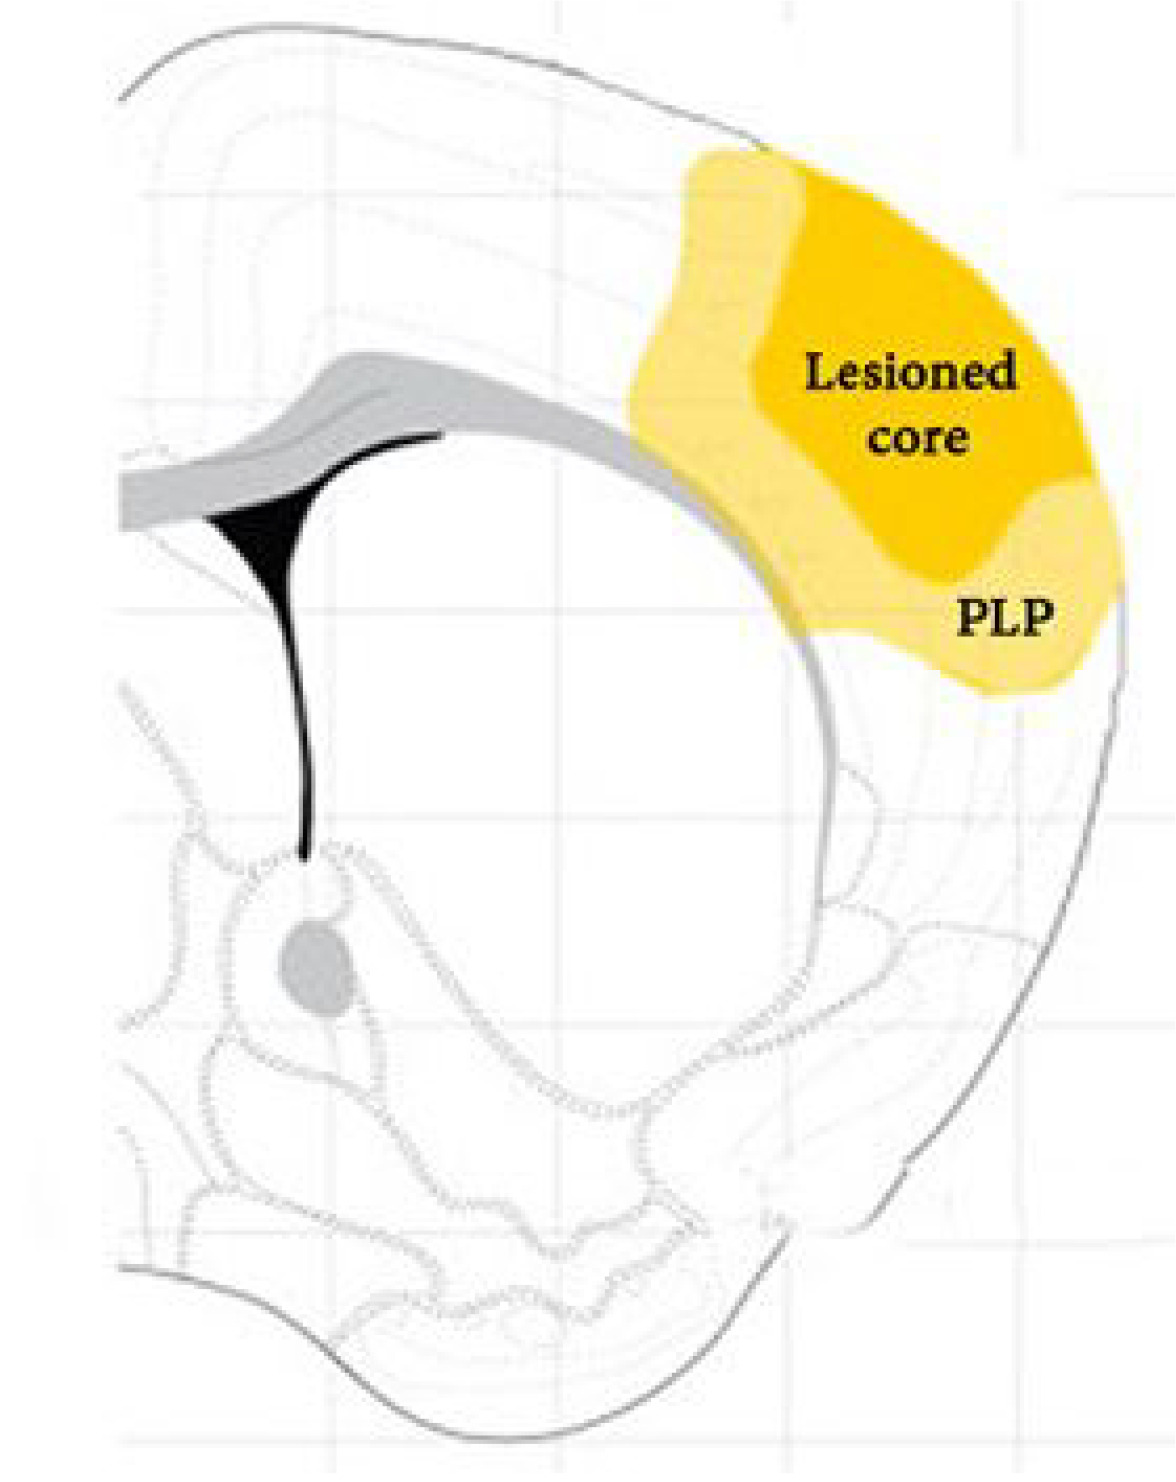
Fig. 1.
Scheme illustrating the lesioned core (dark yellow) and the penumbra part (PLP) (light yellow) used to perform all quantifications throughout the study. Adapted from Perego et al. 2011 [
33
].
Exp Neurobiol 2022;31:173~195
https://doi.org/10.5607/en21035
© Exp Neurobiol
© 2019.
The Korean Society for Brain and Neural Sciences
. / Powered by
INFOrang Co., Ltd