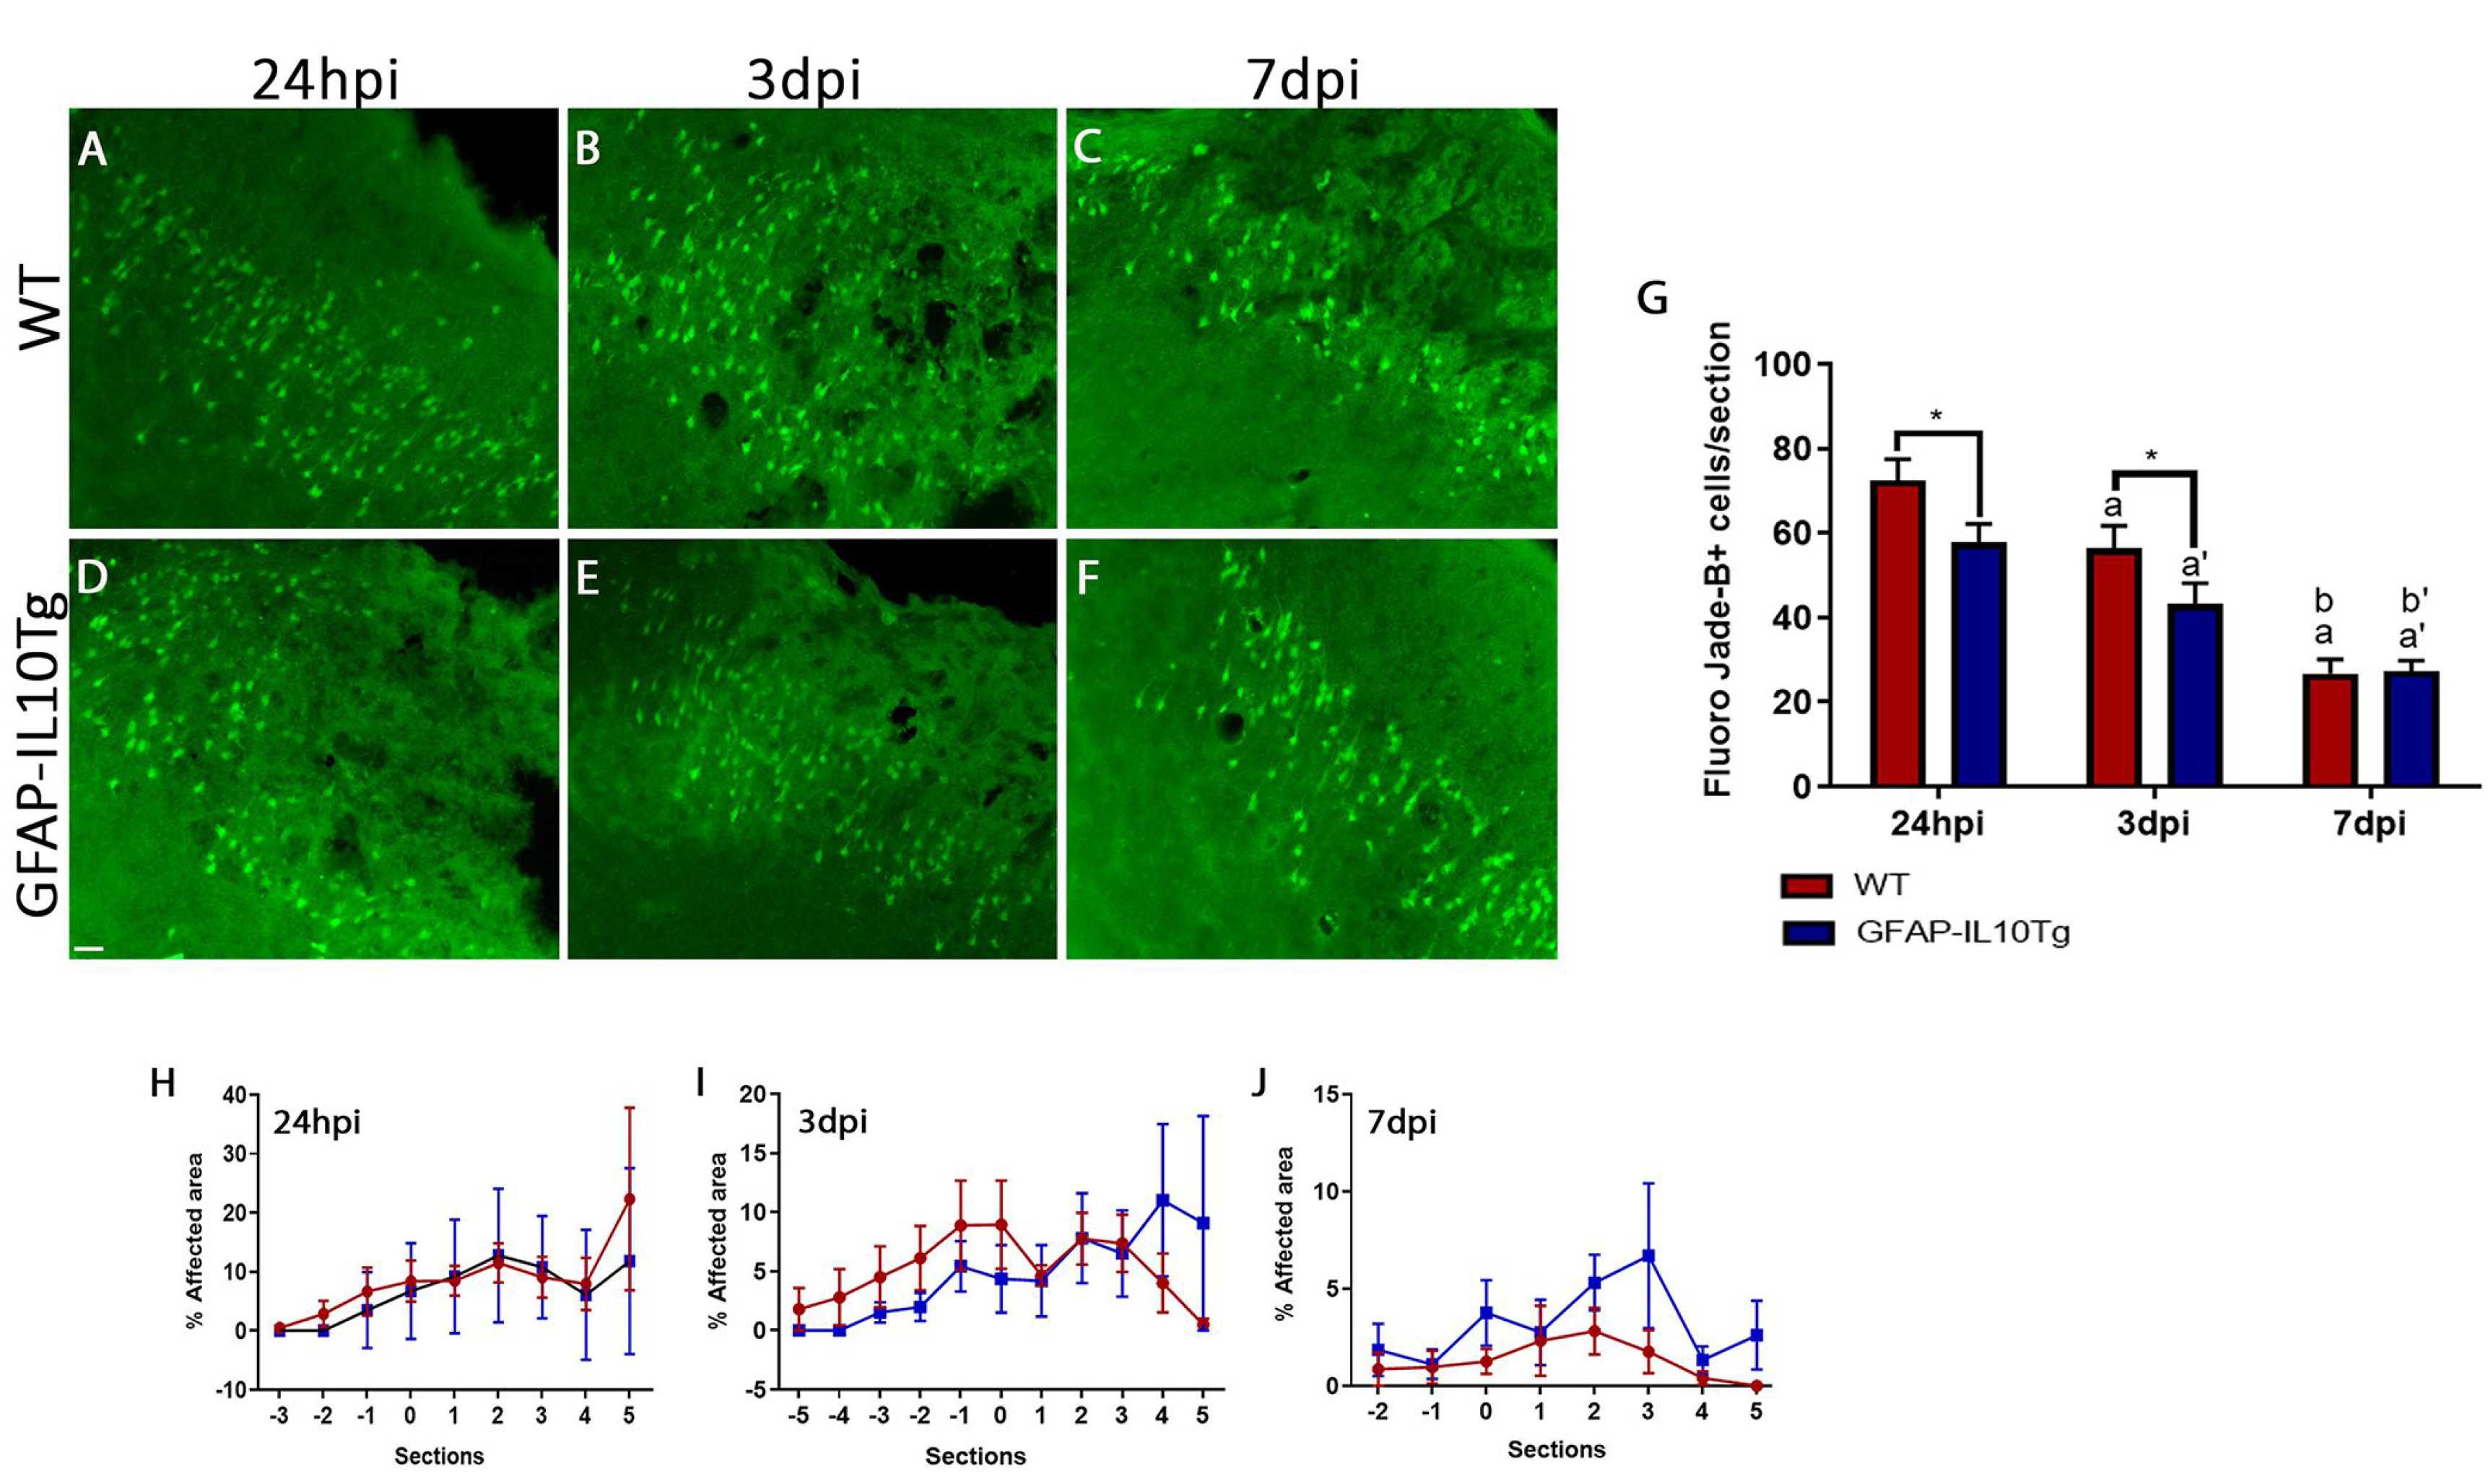
Fig. 3. Fluoro Jade-B staining. (A~F) Representative images revealing Fluoro Jade-B+ neurons (green) indicative of neuronal degeneration within the penumbra area in WT (A~C) and GFAP-IL10Tg animals (D~F). (G) Graph showing the quantification of Fluoro Jade-B (FJ-B)+ cells along the different time-points after TBI. Note that transgenic animals showed lower degenerating neurons, in comparison to WT, at 24 hpi and 3 dpi. (H~J) Graphs showing the quantification of lesion volume at 24 hpi (H), 3 dpi (I) and 7 dpi (J) in both WT and GFAP-IL10Tg animals. No significant differences between WT and GFAP-IL10Tg animals were observed at any time-point analyzed. Data are represented as mean±SEM (*p≤0.05). In WT animals: “a” indicates significance vs 24 hpi, “b” indicates significance vs 3 dpi. In GFAP-IL10Tg animals: “a’” indicates significance vs 24 hpi, “b’” indicates significance vs 3 dpi. Scale bar=50 µm.
© Exp Neurobiol