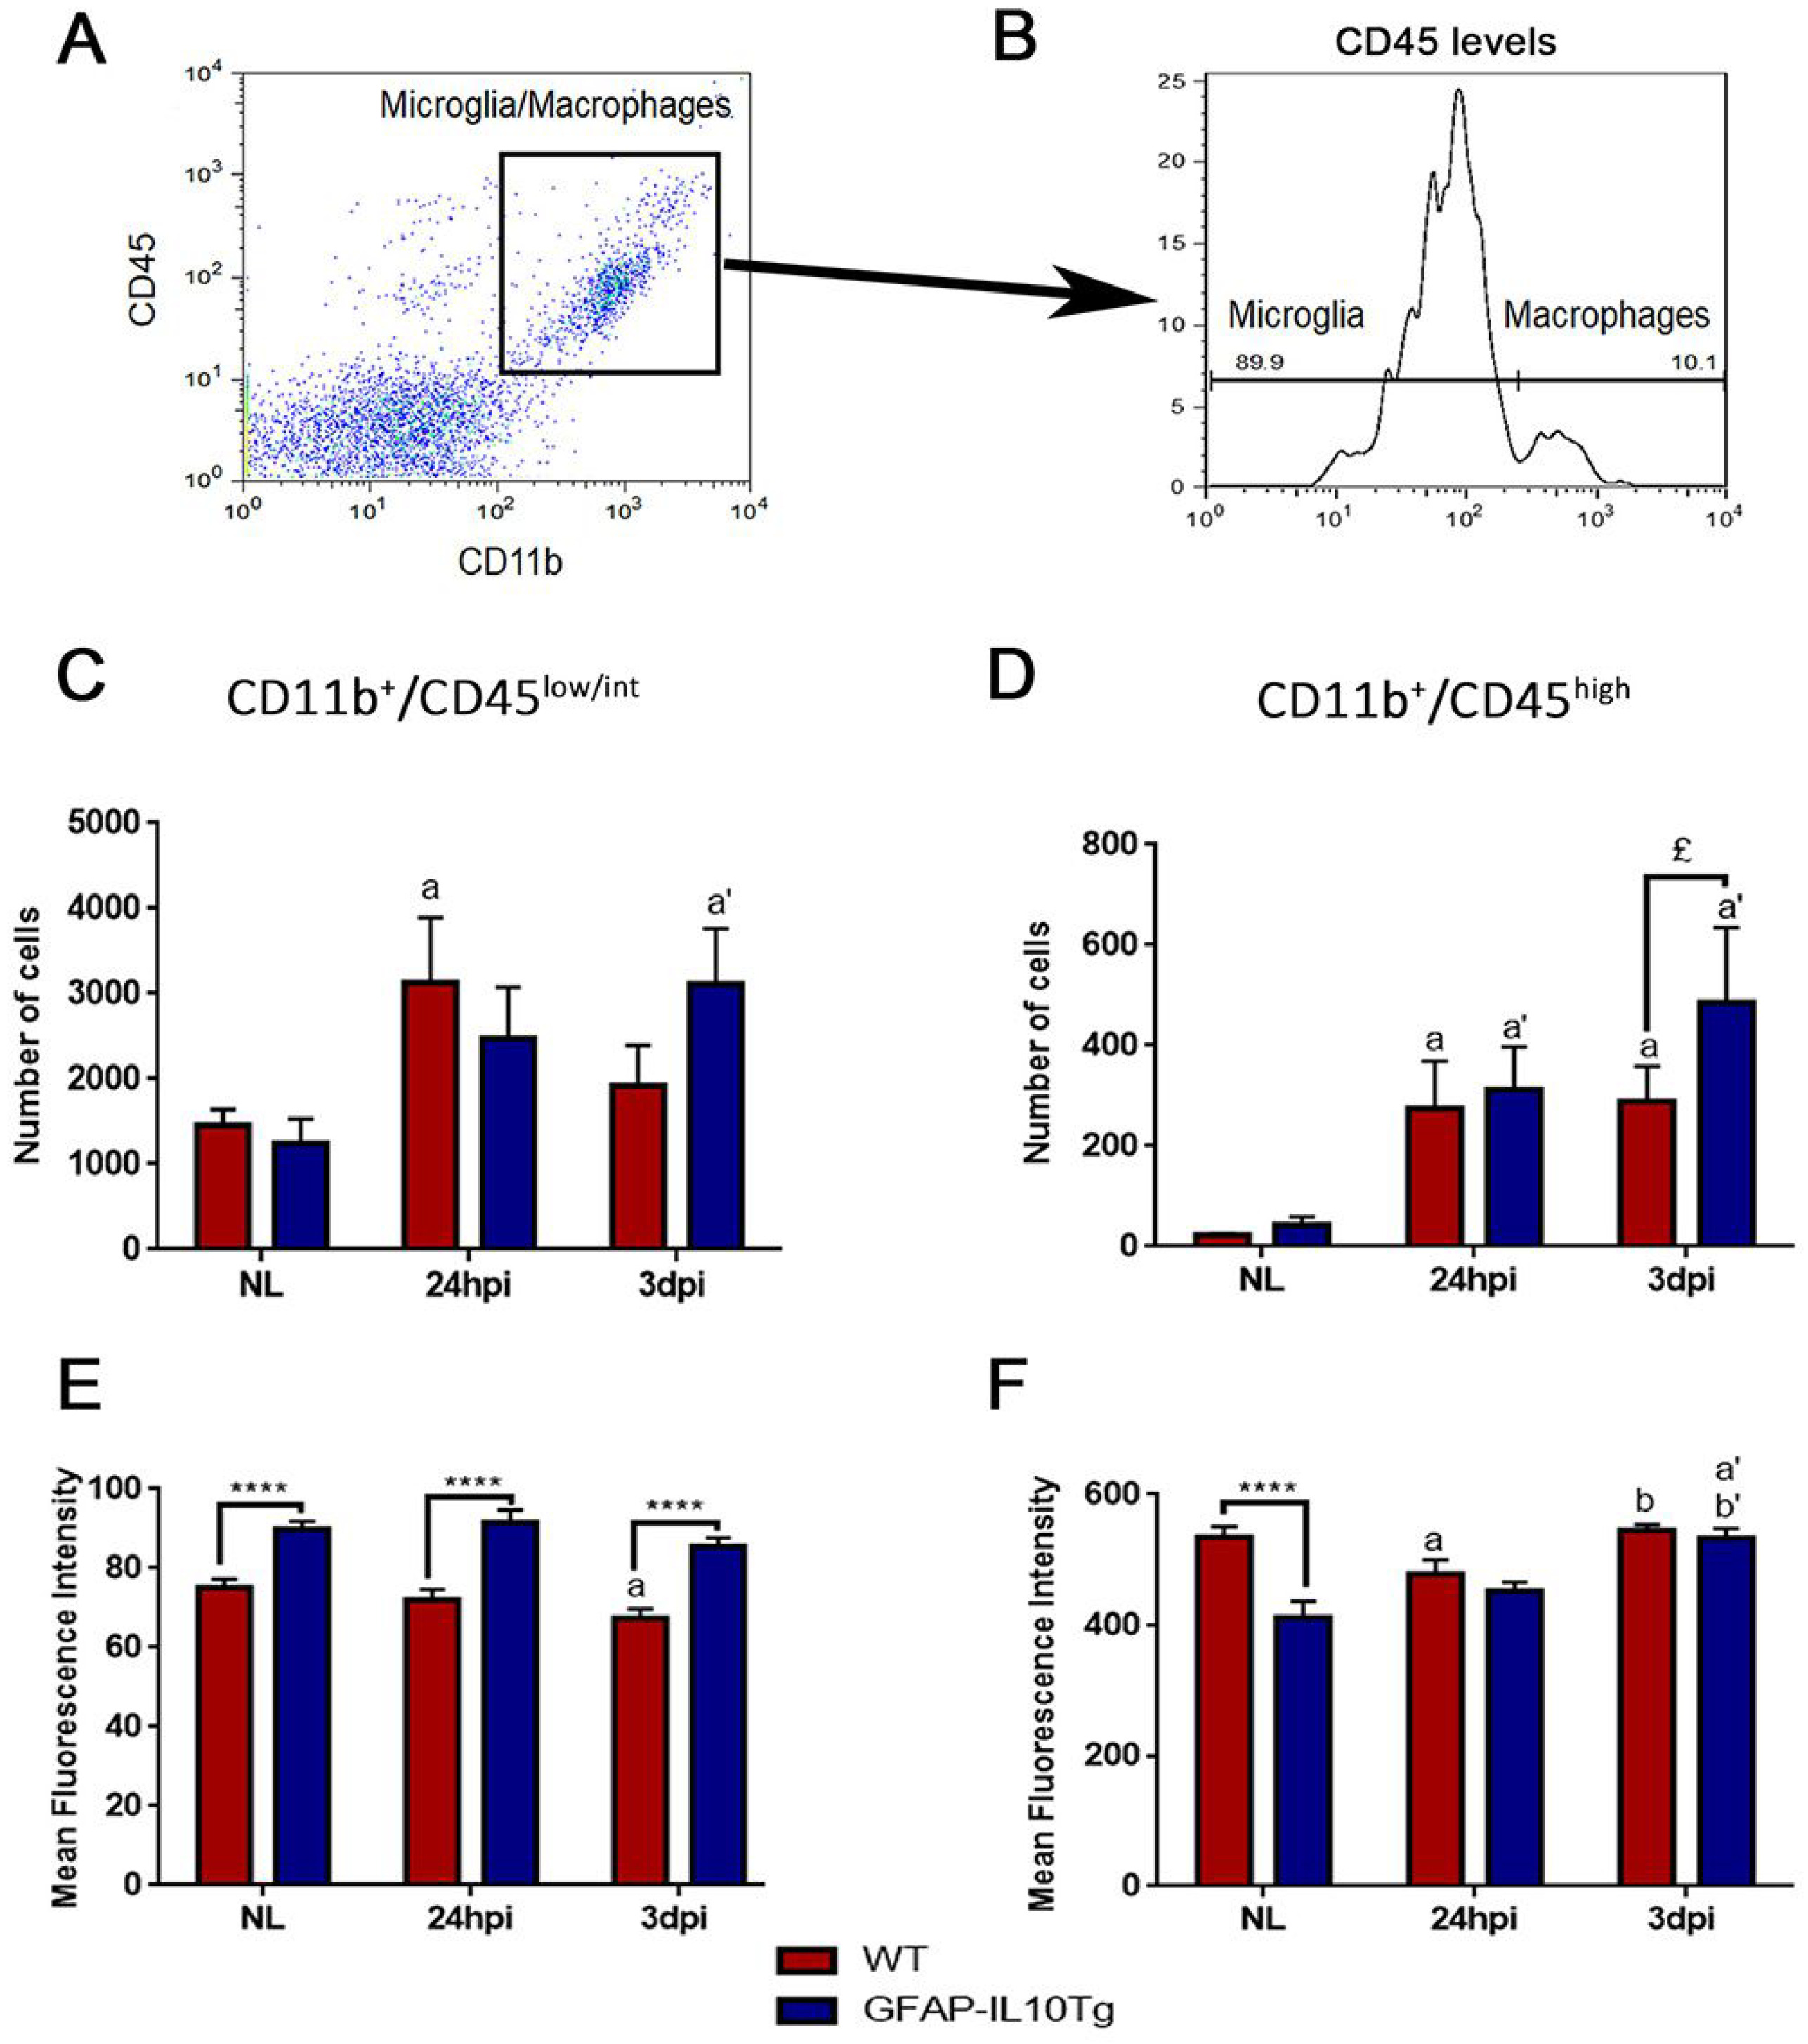
Fig. 4. Microglia and Macrophage populations. (A) Representative density plot of CD11b+/CD45+ cells in the cortex. (B) Histogram showing the gating strategy to study microglia (CD11b+/CD45low/int) and macrophage (CD11b+/CD45high) cells. (C, D) Graphs showing the number of cells in the microglia (CD11b+/CD45low/int) and the macrophage (CD11b+/CD45high) populations in the cortex of non-lesioned (NL) and TBI-lesioned animals at 24 hpi and 3 dpi in WT and GFAP-IL10Tg animals. (E, F) Graphs showing the intensity of CD45 in microglia (CD11b+/CD45low/int) and macrophage (CD11b+/CD45high) populations of non-lesioned (NL) and lesioned animals at 24 hpi and 3 dpi, in both WT and GFAP-IL10Tg mice. All values are indicated as mean±SEM (£p≤0.1, ****p≤0.0001). In WT animals: “a” indicates significant vs NL, “b” indicates significant vs 24 hpi. In GFAP-IL10Tg animals: “a’” indicates significant vs NL, “b’” indicates significant vs 24 hpi.
© Exp Neurobiol