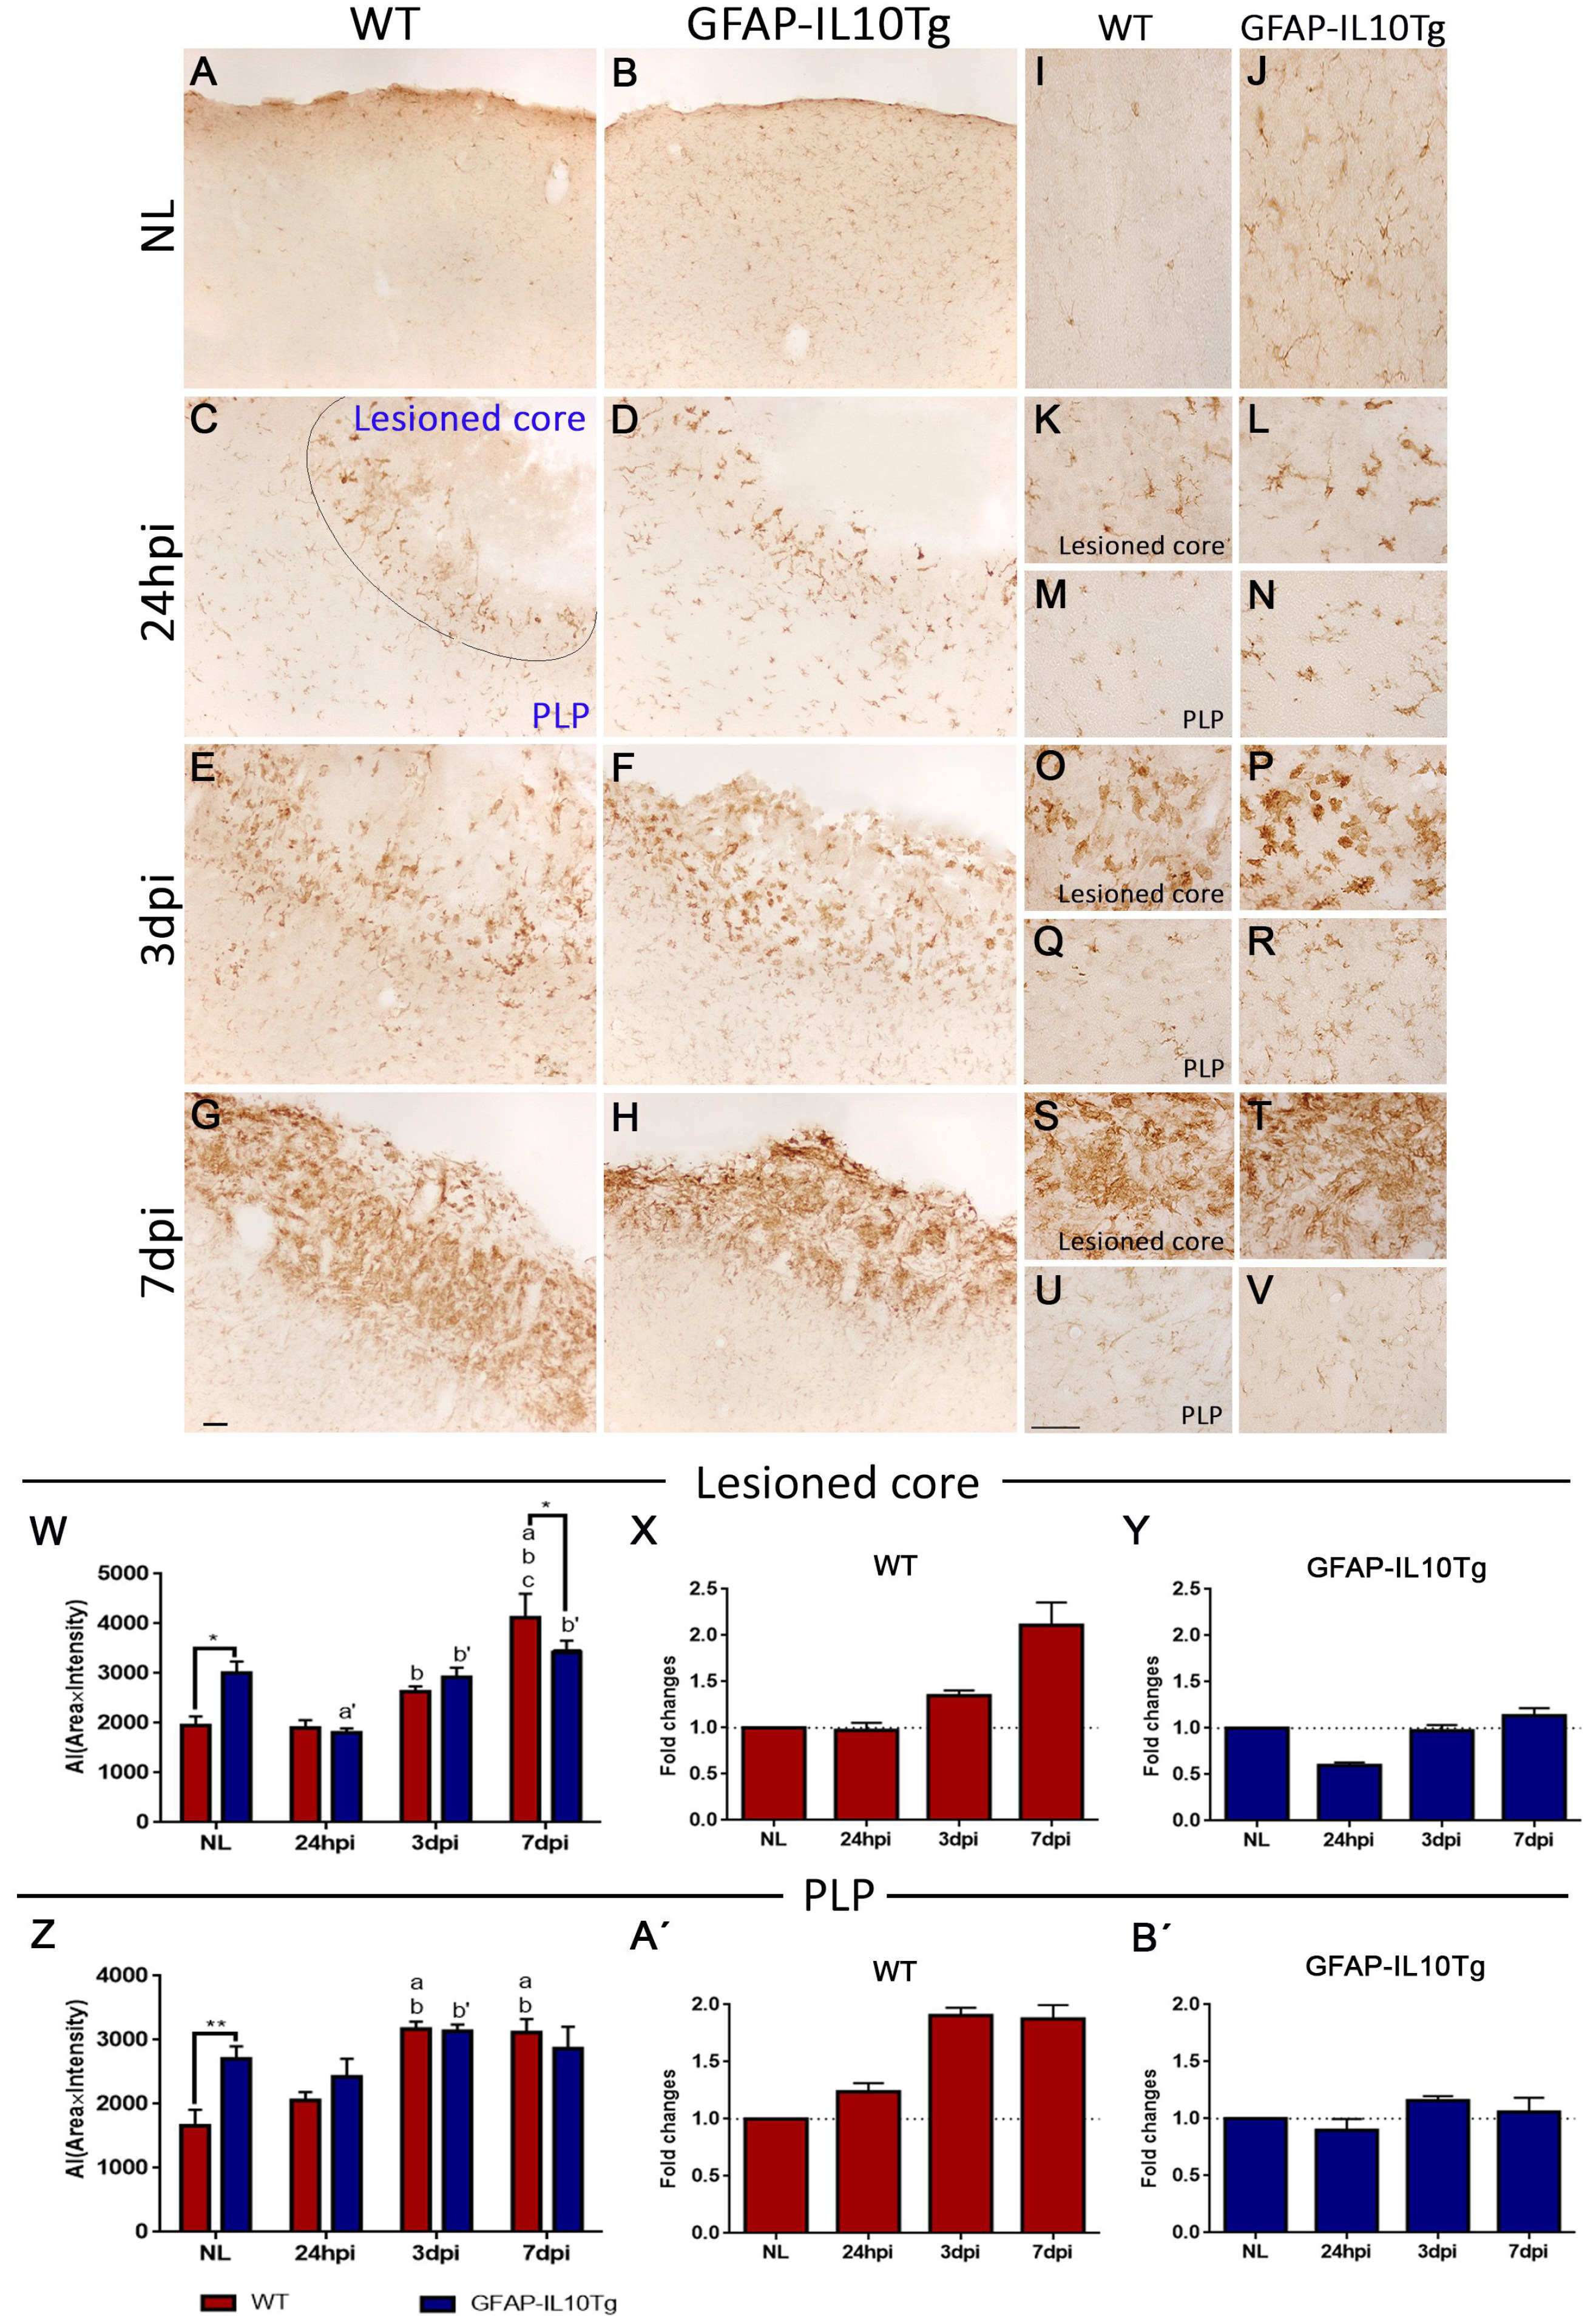
Fig. 5. Iba1 immunohistochemistry. (A~V) Representative images from WT and GFAP-IL10Tg animals showing Iba1 immunoreactivity in the cortex of non-lesioned (NL) (A, B, I, J), and in the affected area of TBI-injured animals from 24 hpi to 7 dpi (C~H, K~V). (W, Z) Graphs showing the quantification of Iba1 immunoreactivity as the AI (Area ˣ Intensity) after TBI at lesioned core (W) and PLP (Z). Note that microglia in NL GFAP-IL10Tg animals (W, Z) showed higher Iba1 immunoreactivity than did WT, associated with thicker and elongated morphologies (I, J). After TBI, a reduction of Iba1 labeling was observed in transgenic animals at 7 dpi in the lesioned core (W). (X, Y, A’, B’) Graphs showing the fold changes of Iba1 expression, in comparison to the respective NL animals in WT (X, A’) and GFAP-IL10Tg (Y, B’) animals in the affected area. GFAP-IL10Tg animals showed a significant lower fold increase of Iba1 than did WT in both lesioned core and PLP parts. All values corresponded to mean±SEM (*p≤0.05, **p≤0.01). In WT animals: “a” indicates significant vs NL, “b” indicates significant vs 24 hpi, “c” indicates significant vs 3 dpi. In GFAP-IL10Tg animals: “a’” indicates significant vs NL, “b’” indicates significant vs 24 hpi. Scale bar=50 μm.
© Exp Neurobiol