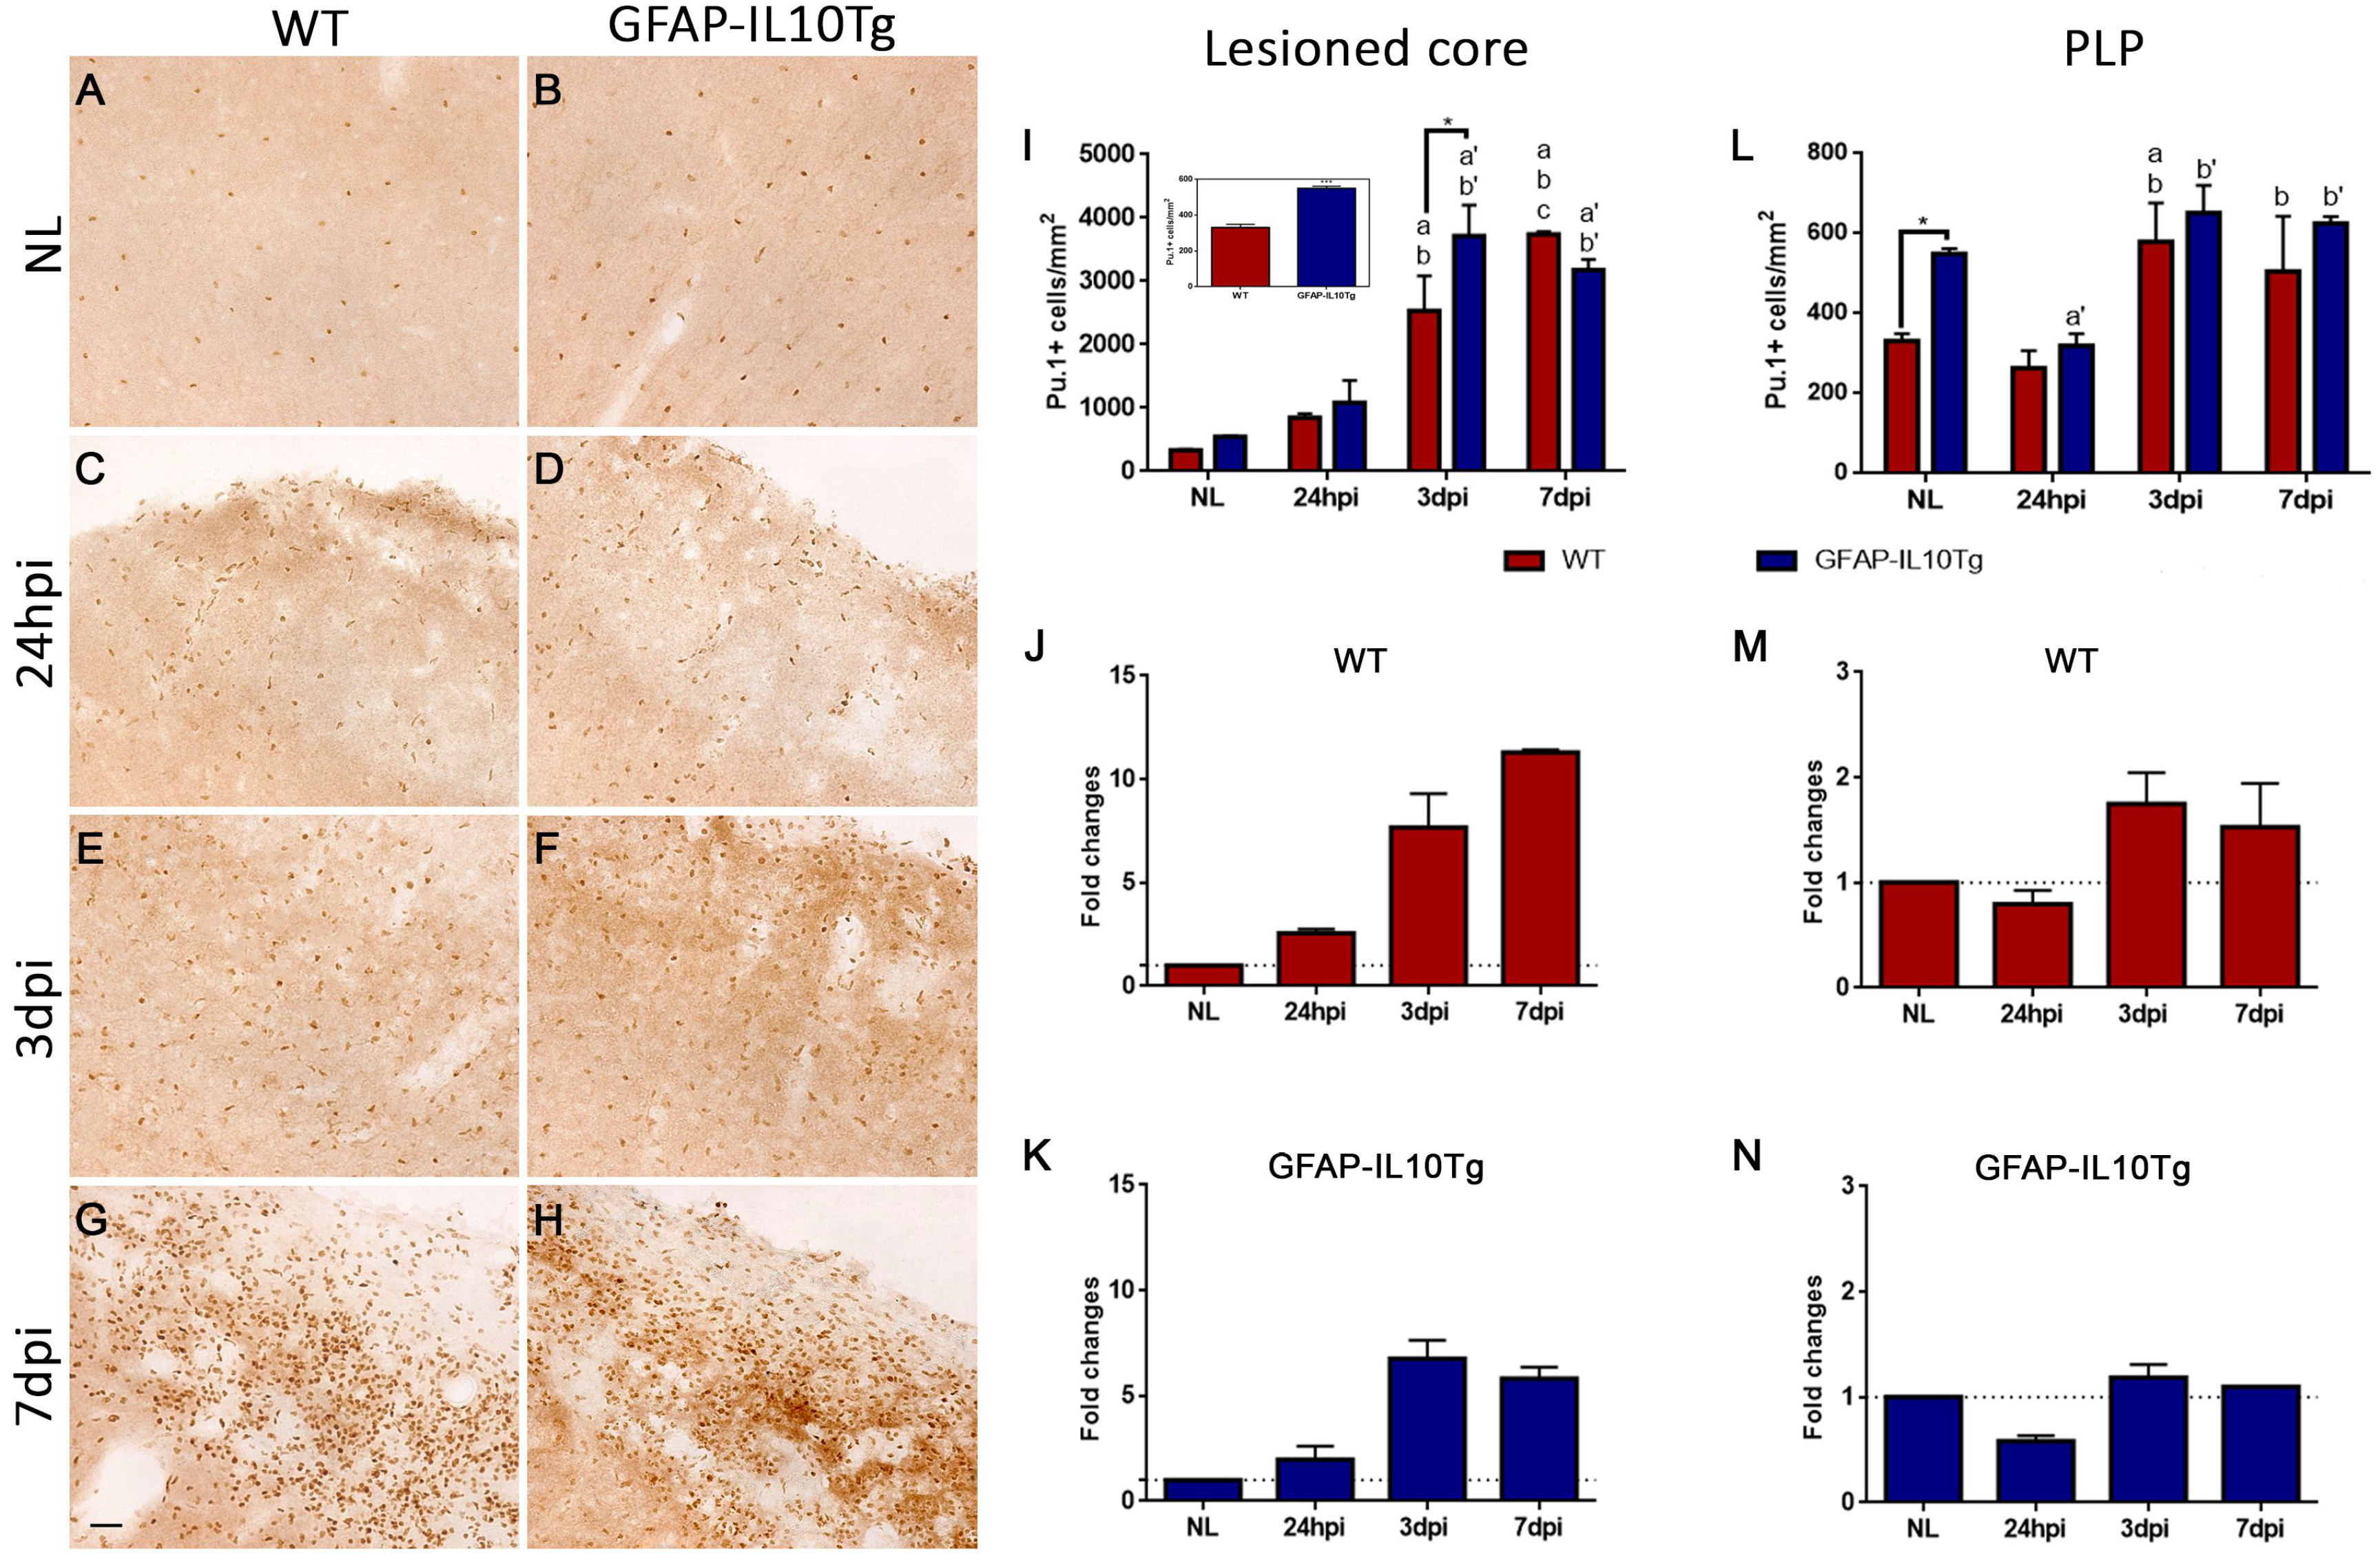
Fig. 6. Pu.1 immunohistochemistry. (A~H) Representative images showing Pu.1+cells in the NL WT (A) and NL GFAP-IL10Tg (B) as well as the lesioned core of both WT (C, E, G) and GFAP-IL10Tg (D, F, H) animals. (I, L) Graphs showing the quantification of Pu.1+ cells of both WT and GFAPIL10Tg in non-lesioned (NL) and lesioned animals from 24 hpi to 7 dpi in the lesioned core (I) and PLP part (L). Note that GFAP-IL10Tg animals showed a higher number of Pu.1+cells in NL (insert in I) and at 3 dpi. (J, K, M, N) Graphs showing the fold change of Pu.1+ cells in WT (J, M) and GFAPIL10Tg (K, N), in comparison to their corresponding NL animals. Note that, in GFAP-IL10Tg mice, the fold increase of Pu.1+ cells along the injury is less pronounced than in WT, especially at 7 dpi in the lesioned core. All values are indicated as mean±SEM (*p≤0.05, ***p≤0.001). In WT animals: “a” indicates significance vs NL, “b” indicates significance vs 24 hpi, “c” indicates significance vs 3 dpi. In GFAP-IL10Tg animals: “a’” indicates significance vs NL, “b’” indicates significance vs 24 hpi. Scale bar=30 μm.
© Exp Neurobiol