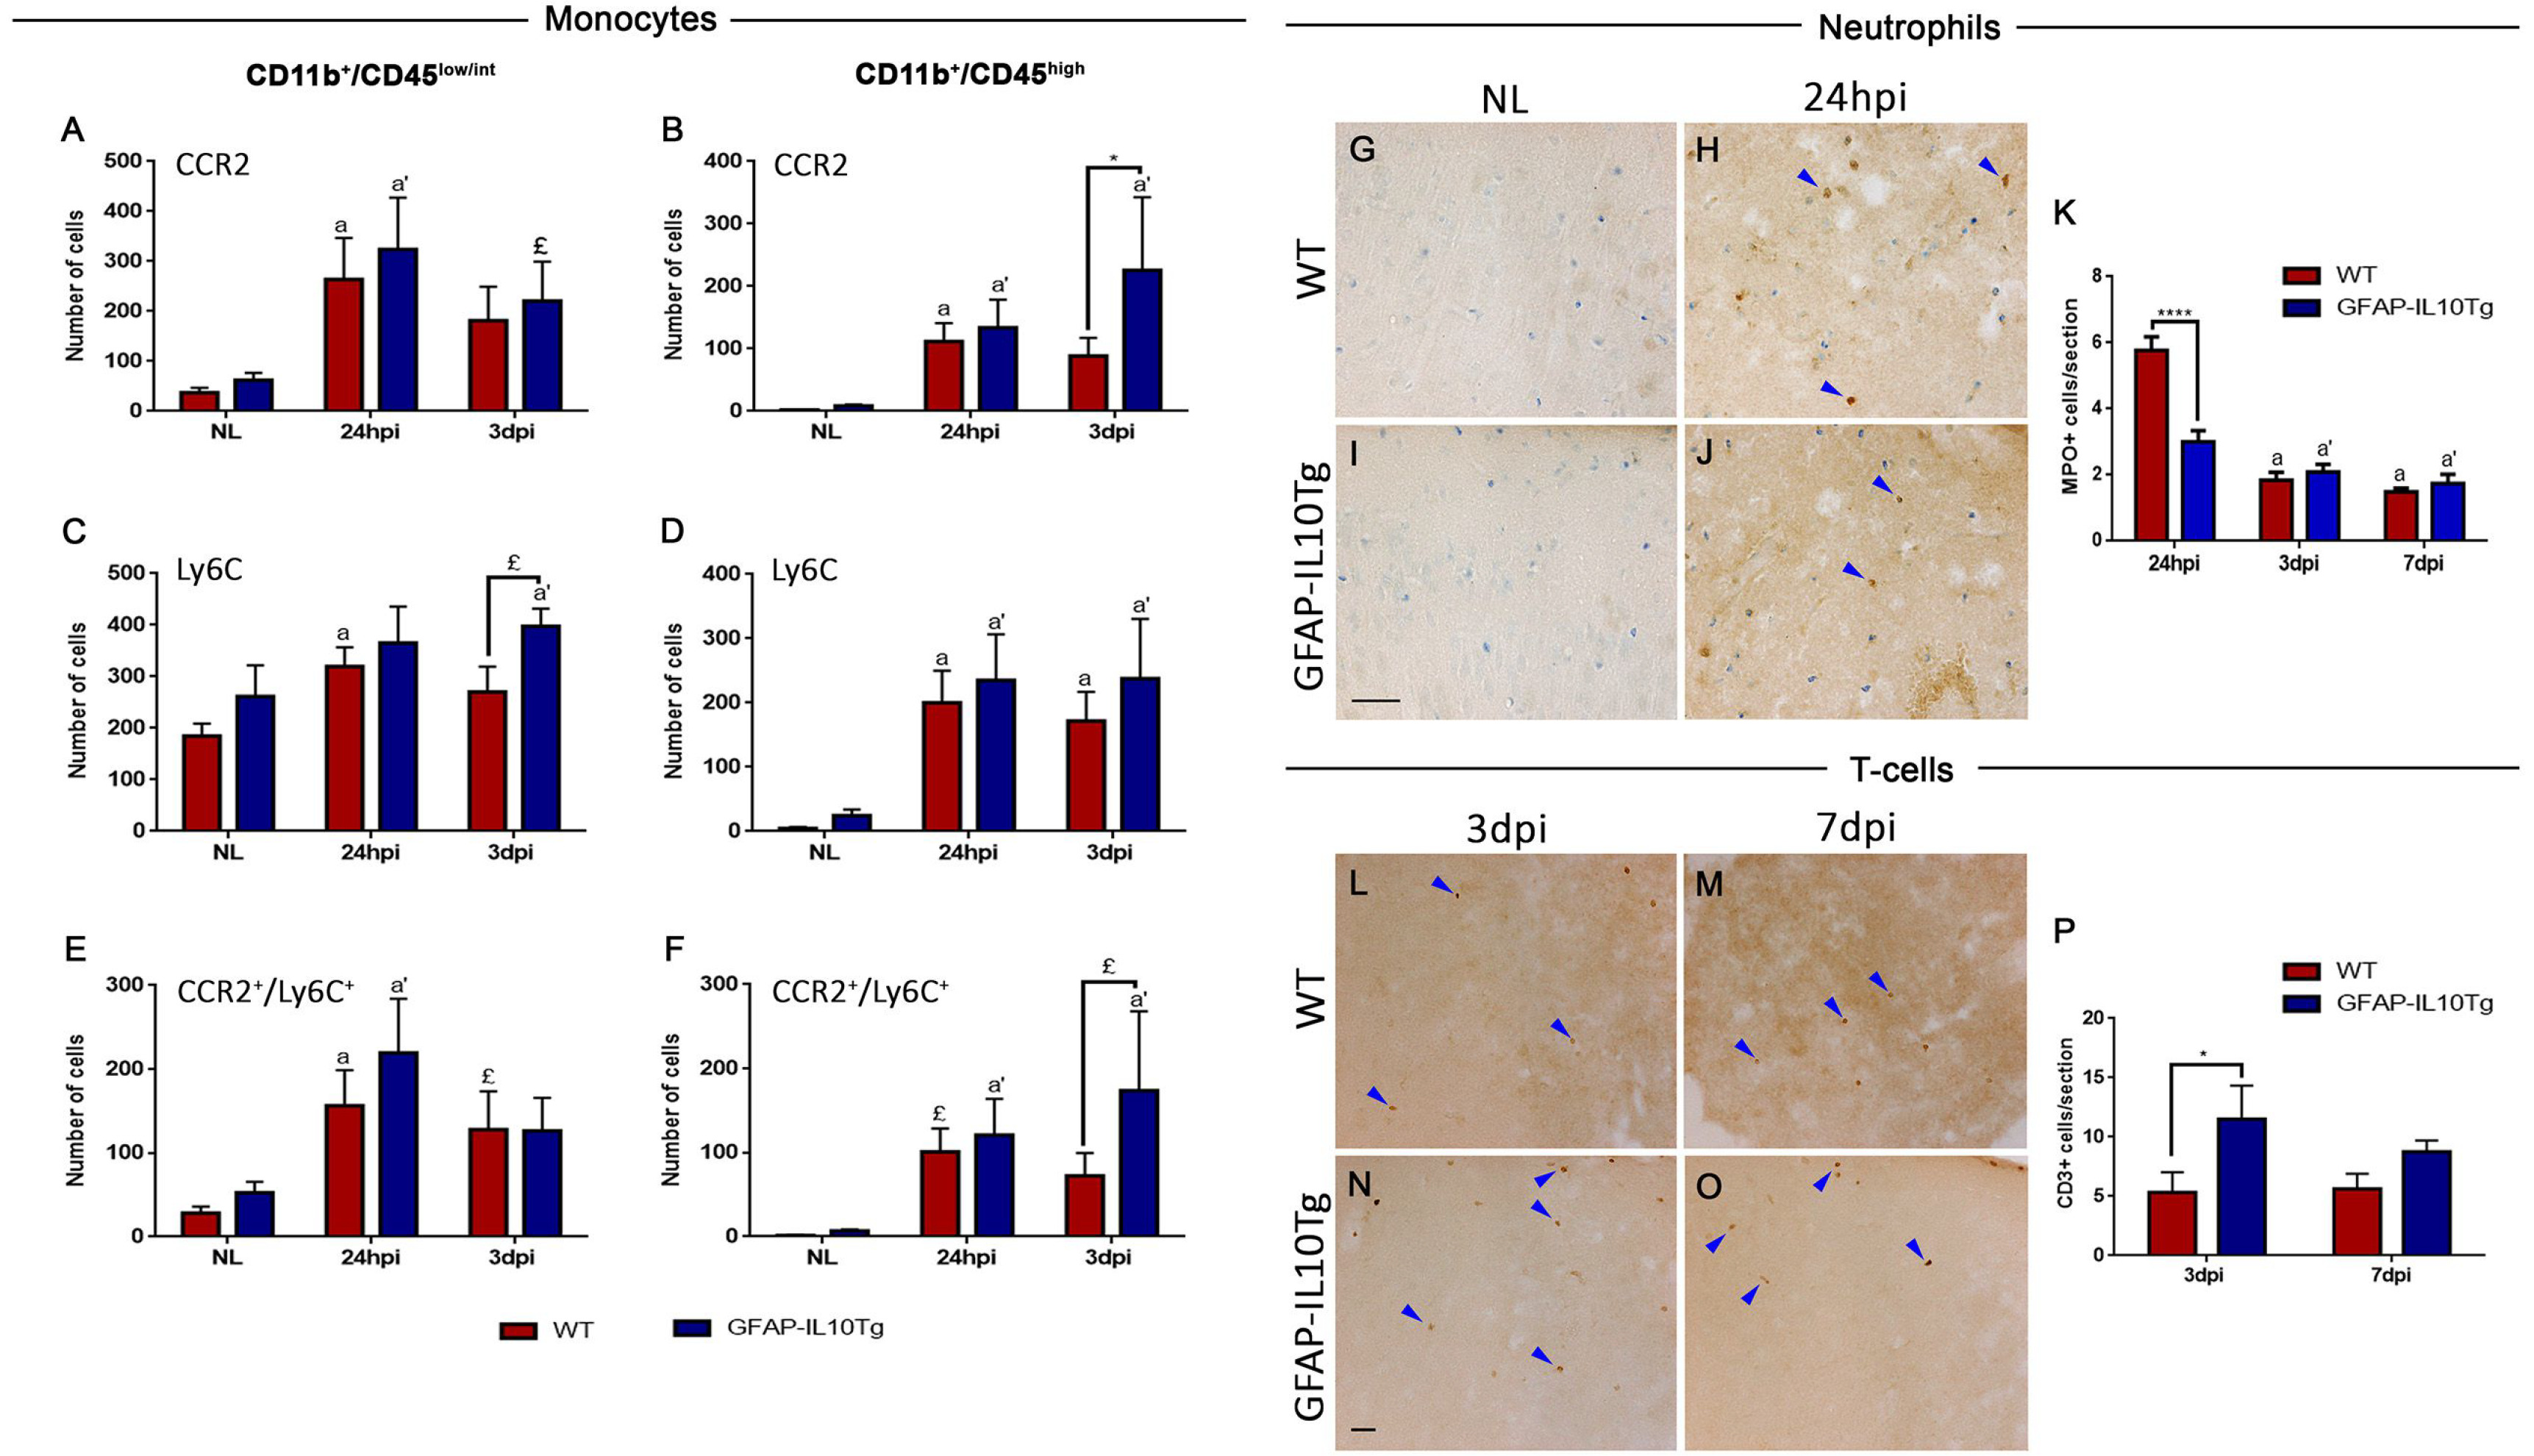
Fig. 9. Peripheral immune cell infiltration. (A~D) Graphs showing the number of CCR2+ and Ly6C+ cells in the microglia (CD11b+/CD45low/int) and macrophage (CD11b+/CD45high) populations in non-lesioned (NL) and lesioned animals at 24 hpi and 3 dpi in WT and GFAP-IL10Tg mice. (E, F) Graphs showing the quantification of CCR2+/Ly6C+ inflammatory monocytes in non-lesioned (NL) and TBI-lesioned animals at 24 hpi and 3 dpi in WT and GFAP-IL10Tg mice. Inflammatory monocytes exhibited a significant increase in transgenic animals at 3 dpi. In WT animals: “a” indicates significant vs NL and in GFAP-IL10Tg animals: “a’” indicates significant vs NL. (G~J) Representative images showing the number of myeloperoxidase (MPO)+ cells (arrowheads) in the penumbra of TBI-lesioned WT (H) and GFAP-IL10Tg animals (J) at 24 hpi. Toluidine blue staining was used as a nuclei marker. (K) Graph showing the quantification of MPO+cells in WT and GFAP-IL10Tg animals from 24 hpi to 7 dpi. Note that, at 24 hpi, GFAP-IL10Tg animals presented a significantly lower number of MPO+ cells than did WT. In WT animals: “a” indicates significant vs 24 hpi. In GFAP-IL10Tg animals: “a’” indicates significant vs 24 hpi. (L~O) Representative images showing the number of CD3+ T lymphocytes (arrowheads) in the penumbra of both WT (L, M) and GFAP-IL10Tg animals (N, O) at 3 dpi and 7 dpi. (P) Graph showing the quantification of CD3+ T lymphocytes in WT and GFAP-IL10Tg animals at 3 dpi and 7 dpi. Note that,GFAP-IL10Tg presented a higher number of CD3+ lymphocytes than did WT at 3 dpi. All values are represented as mean±SEM (£p≤0.1, *p≤0.05, ****p≤0.0001). Scale bar=30 µm.
© Exp Neurobiol